Don't Ignore This Chart! November 29, 2017 at 10:23 AM
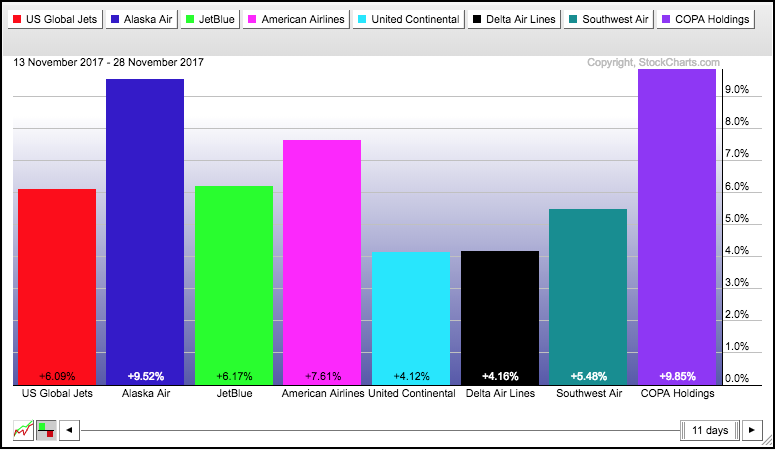
Airline stocks are moving higher again with solid gains across the board over the last two weeks. The PerfChart below shows the performance for the Airline ETF (JETS) and seven other airline stocks since mid November... Read More
Don't Ignore This Chart! November 28, 2017 at 05:17 PM
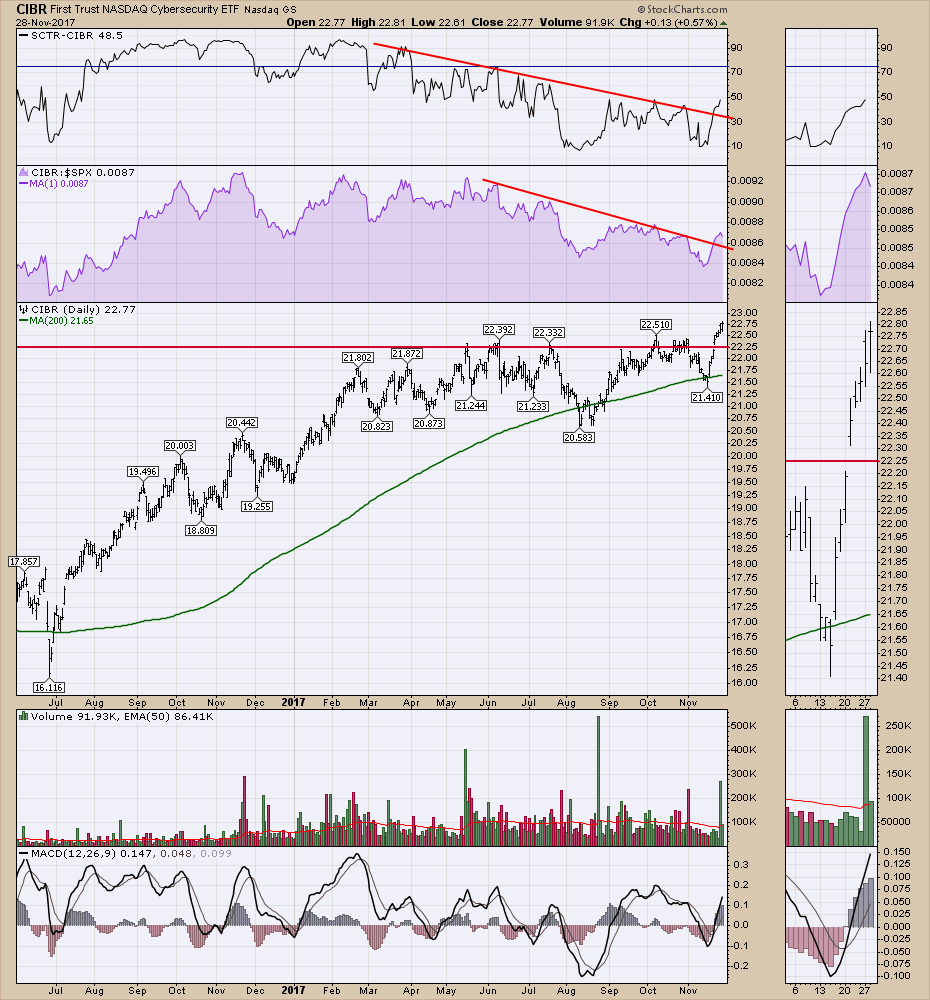
The cybersecurity ETF (CIBR) broke out to new highs late last week. The chart shows a couple of downtrends also breaking. In this vertical market where everything is up, a stock that consolidates sideways for any length of time looks pretty weak... Read More
Don't Ignore This Chart! November 27, 2017 at 12:31 PM
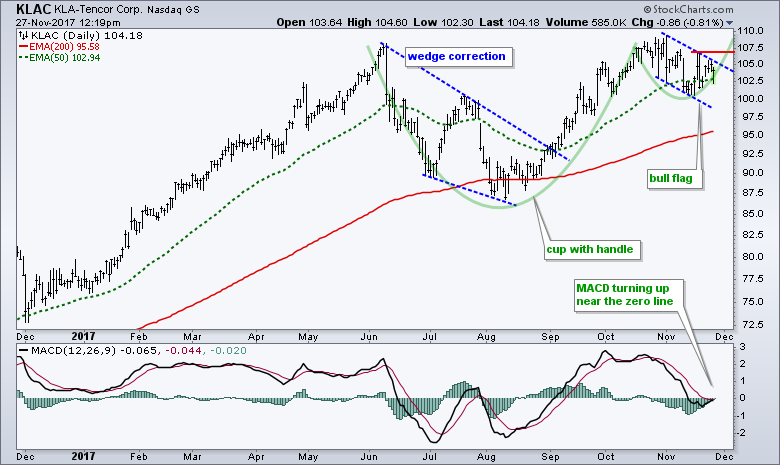
KLA-Tencor (KLAC), a semiconductor equipment and materials designer and manufacturer, is in a long-term uptrend with large and small bullish continuation patterns working. The chart shows 52-week highs in May and October so the long-term trend is clearly up... Read More
Don't Ignore This Chart! November 24, 2017 at 09:36 PM
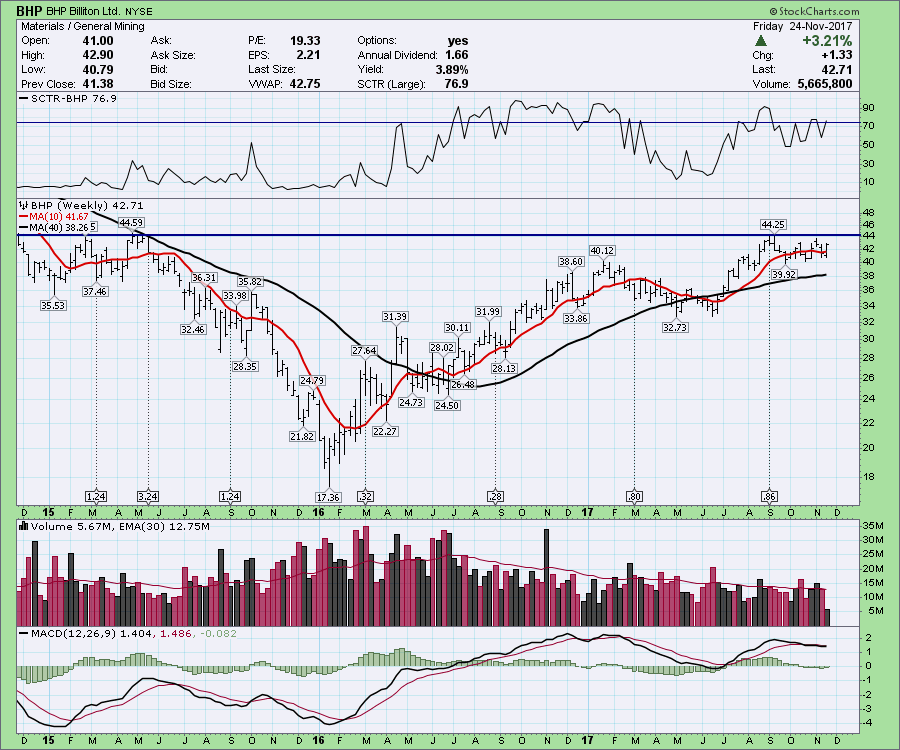
BHP Billiton (BHP) is pausing at resistance after a 30% run from July to September. The stock has a definite primary up trend going. The SCTR in the top panel shows the trend is improving for relative strength. The volume this week was very low with the market closed for 1... Read More
Don't Ignore This Chart! November 22, 2017 at 10:26 AM
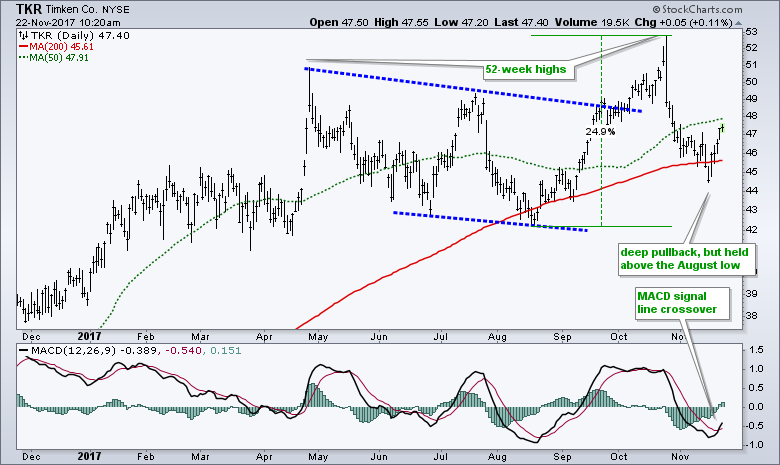
Timken (TKR), a mid-cap industrial, looks like it is resuming its bigger uptrend with a surge off the 200-day SMA. The chart below shows the stock hitting 52-week highs in April and October. The October high formed after a channel breakout and 25% advance... Read More
Don't Ignore This Chart! November 21, 2017 at 11:38 PM
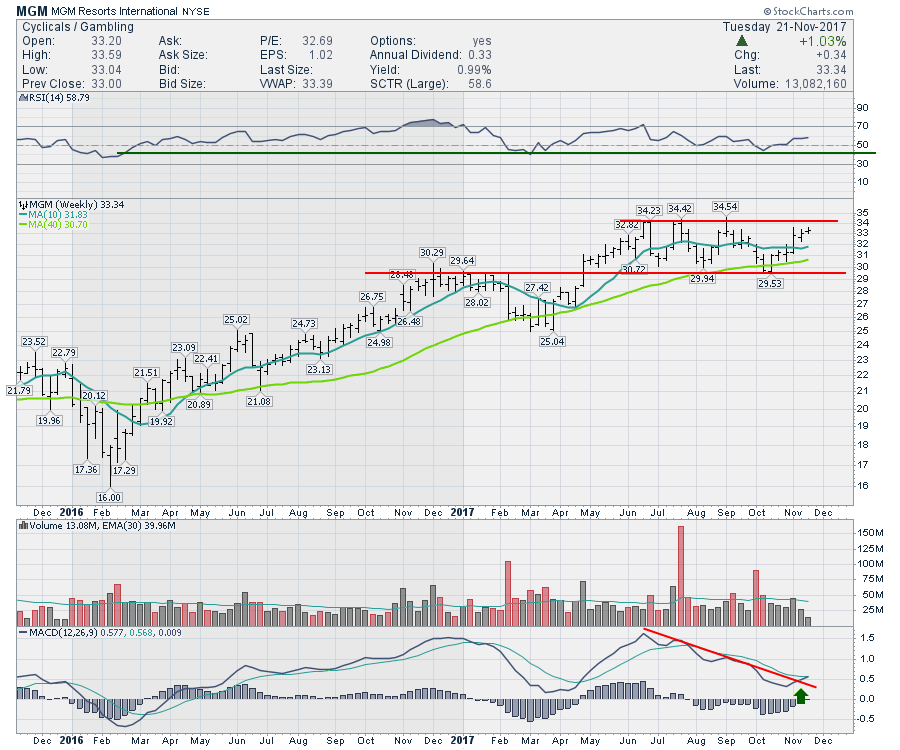
The gambling stocks have performed well over the last few years. MGM has traded sideways while WYNN has continued to climb. The consolidation looks constructive as MGM tries to breakout again... Read More
Don't Ignore This Chart! November 20, 2017 at 08:59 AM
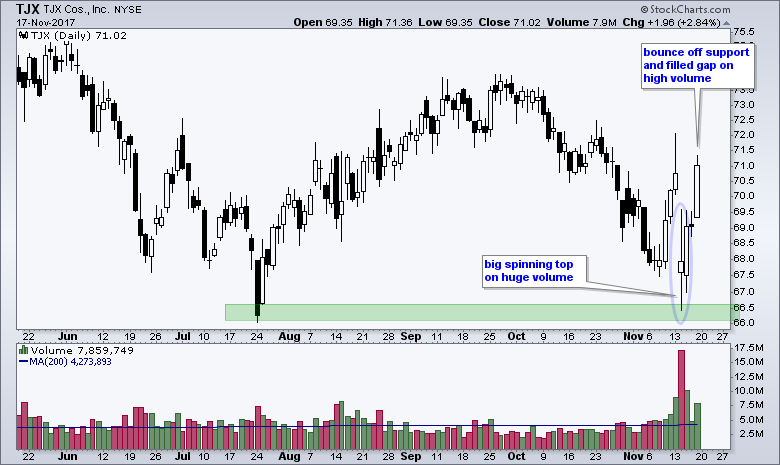
Retail stocks surged last week and discounter TJX Companies ($TJX) bounced off support with high volume. Technically, the big trend is still down because the 50-day EMA is below the 200-day EMA and TJX is below the 200-day EMA... Read More
Don't Ignore This Chart! November 19, 2017 at 10:31 AM
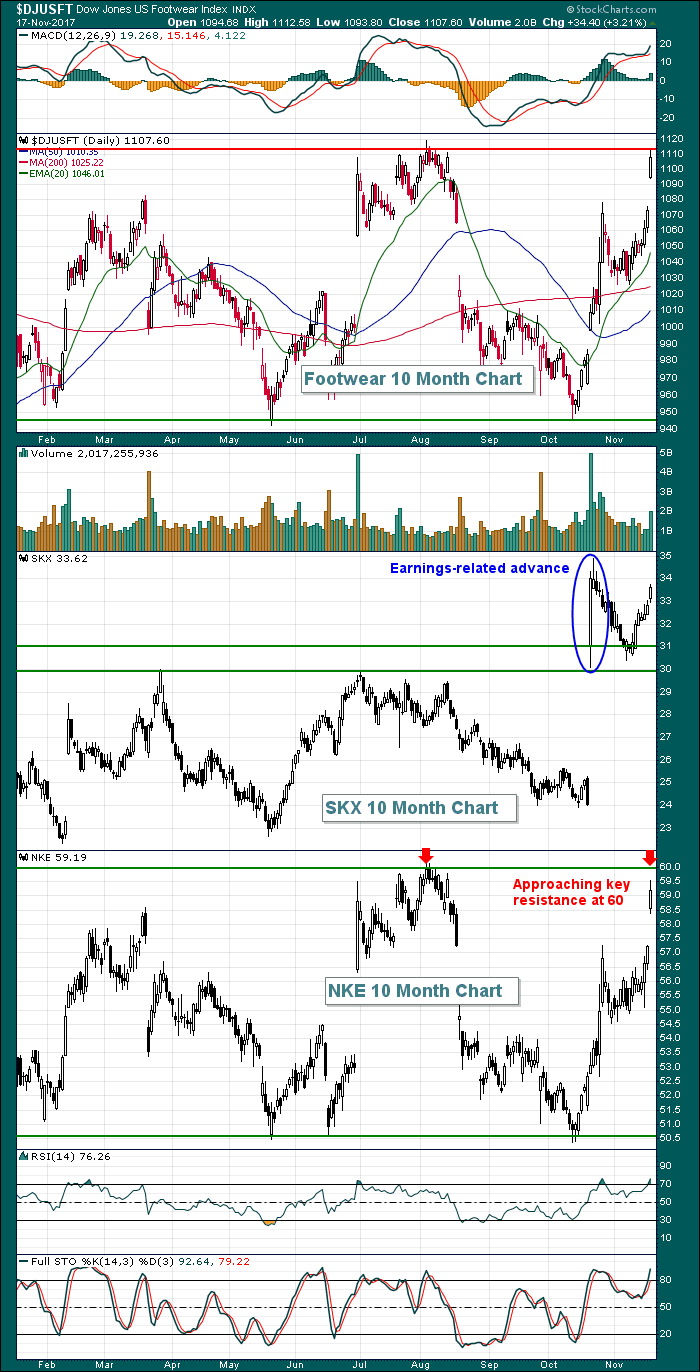
Skechers (SKX) rallied approximately 40% after its most recent quarterly earnings report and Nike (NKE) has gone from 2017 lows to nearly a 2017 high in the past five weeks, highlighting a significant rally in the Dow Jones U.S. Footwear Index ($DJUSFT). The DJUSFT rallied 3... Read More
Don't Ignore This Chart! November 17, 2017 at 07:04 PM
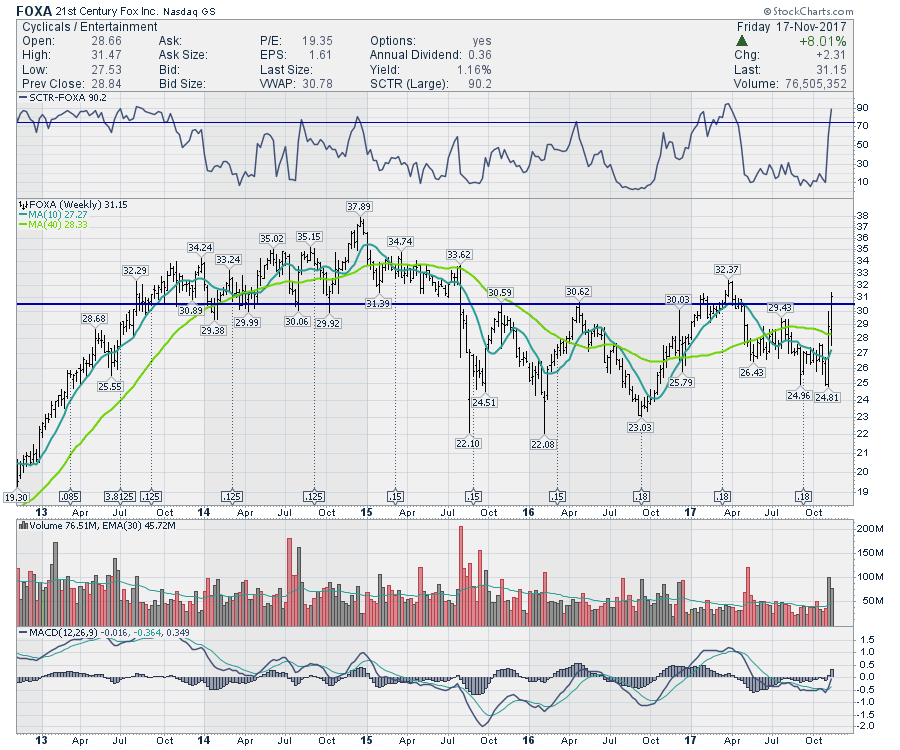
21st Century Fox (FOXA) has been creating the news the last few weeks with merger, acquisitions, and parts spinoffs all part of the discussion. It closed the week at six month highs and above an important 5-year support and resistance line... Read More
Don't Ignore This Chart! November 15, 2017 at 11:48 AM
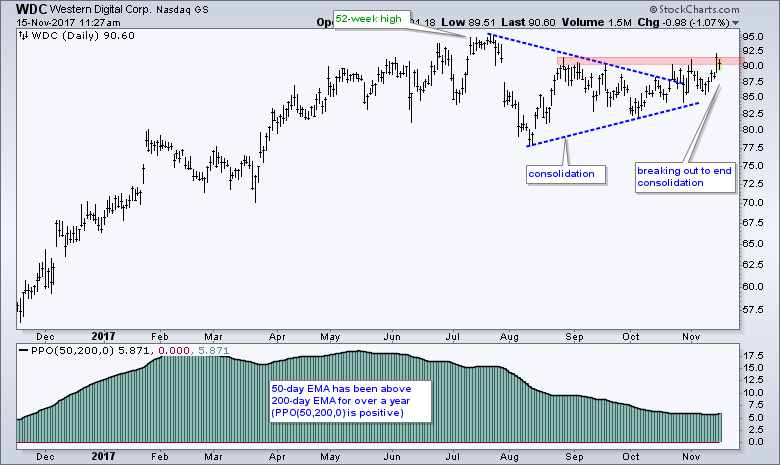
Western Digital (WDC) appears to be emerging from a consolidation pattern and this increases the chances of new highs in the coming weeks. The chart shows WDC hitting a new high in July and then falling with a rather sharp decline into early August... Read More
Don't Ignore This Chart! November 14, 2017 at 11:10 PM
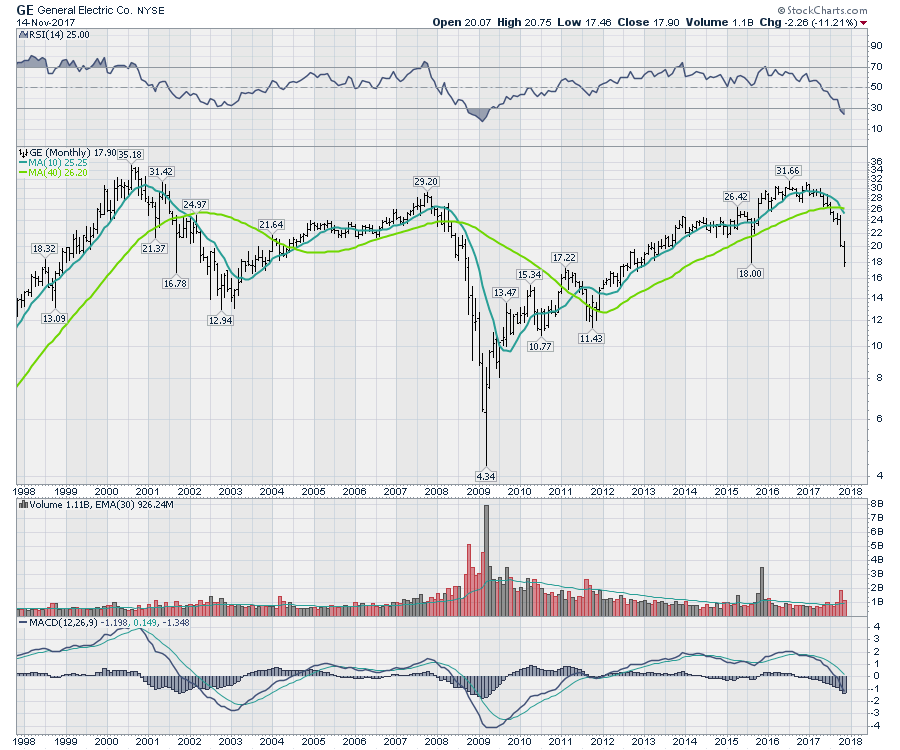
General Electric (GE) has been struggling recently and now the stock dipped to two years lows. For such a blue chip institutional stock, the price action faltering while the overall market is in a big bull trend is almost shocking... Read More
Don't Ignore This Chart! November 13, 2017 at 11:42 AM
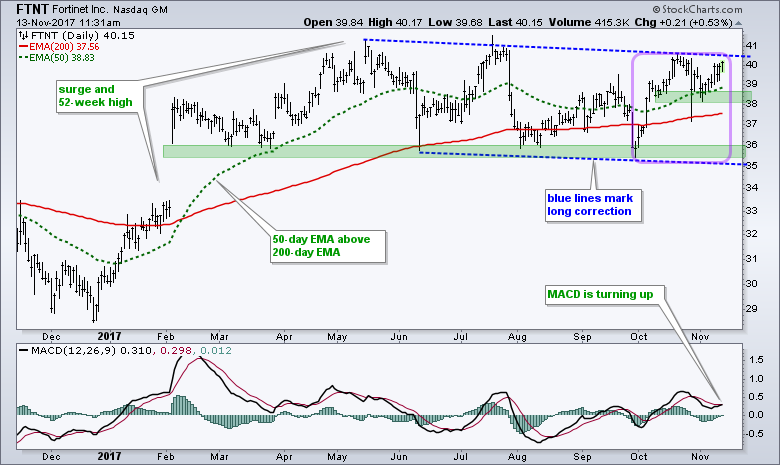
Stocks close to new highs are usually in uptrends and have a good chance of recording new highs in the near future. Fortinet looks poised for a new high as challenges a channel line after an upturn last week... Read More
Don't Ignore This Chart! November 12, 2017 at 11:13 AM
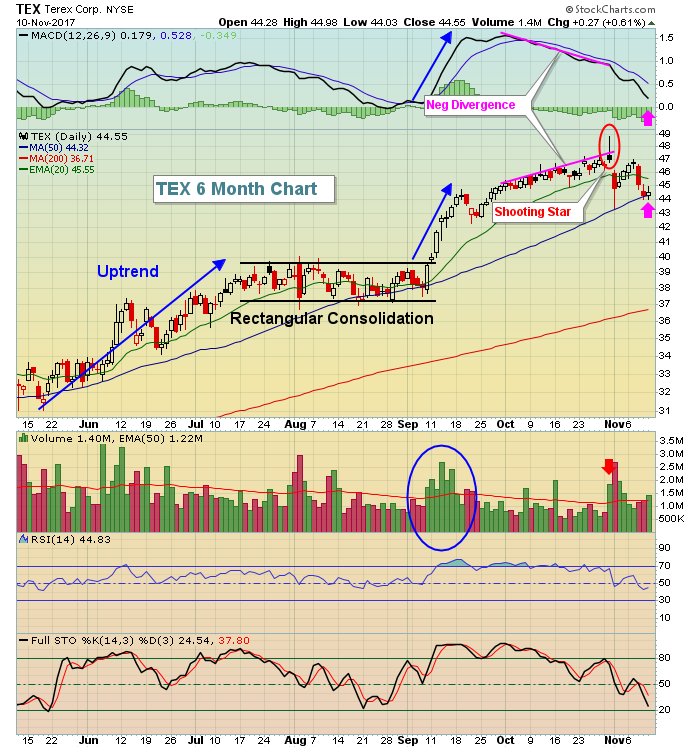
In September, Terex Corp (TEX) saw big volume accompany a breakout of a bullish rectangular consolidation phase. After weeks of trending higher, momentum began to slow and TEX printed a "death" candle - a shooting star on big volume to end the uptrend... Read More
Don't Ignore This Chart! November 11, 2017 at 07:18 PM
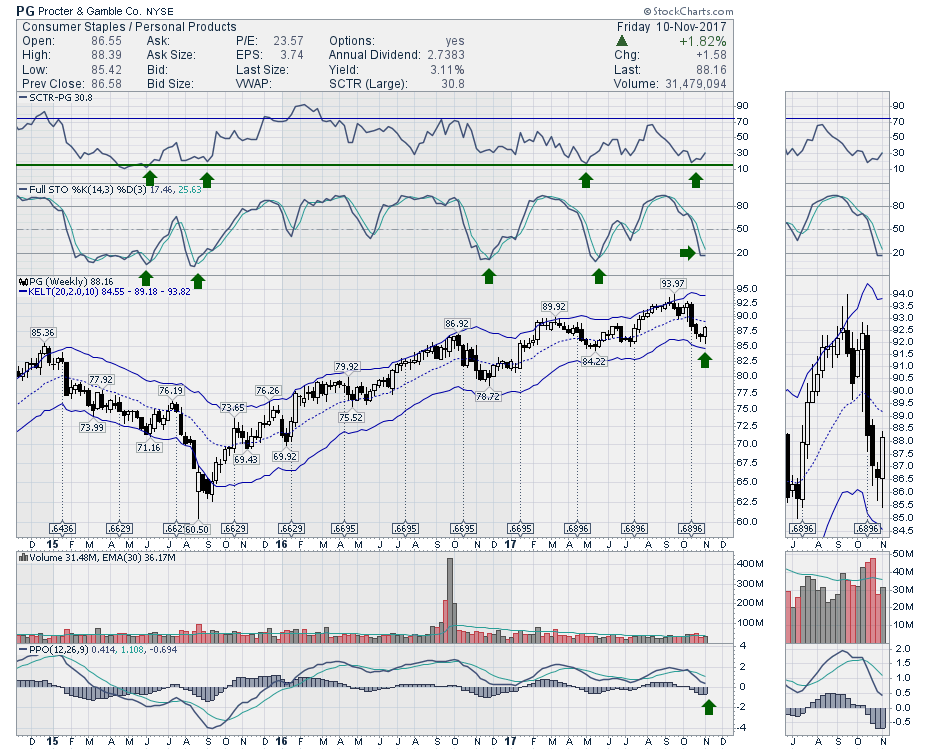
Procter and Gamble (PG) printed an outside reversal this week right near the lower Keltner channel line. While the chart of Proctor and Gamble is trending higher, it's always important to find a nice entry... Read More
Don't Ignore This Chart! November 09, 2017 at 04:12 PM
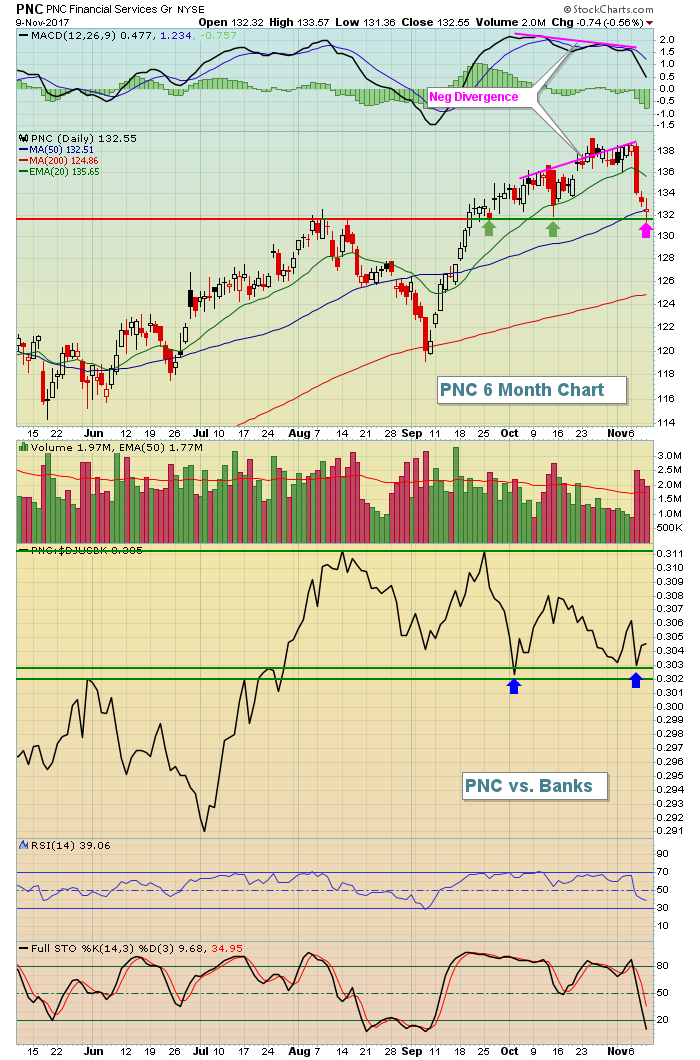
While it would be great for the stock market to rise every day without any selling whatsoever, that's just not practical. As a trader, I await episodes of selling to set up much better reward to risk trades in stocks that remain in long-term uptrends. Enter PNC Financial (PNC)... Read More
Don't Ignore This Chart! November 08, 2017 at 11:47 AM
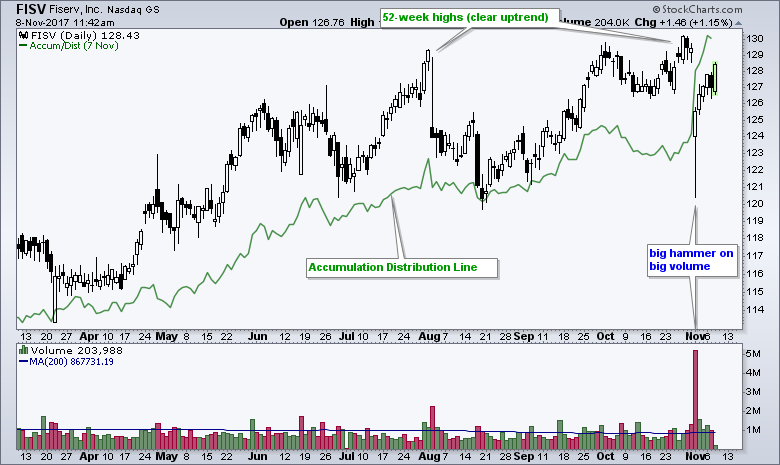
Fiserv gapped down and fell on big volume last week, but the candlestick points to an accumulation day and the Accumulation Distribution Line hit a new high. First and foremost, the big trend is up because Fiserve hit a 52-week high with a move above 130 in late October... Read More
Don't Ignore This Chart! November 07, 2017 at 07:15 PM
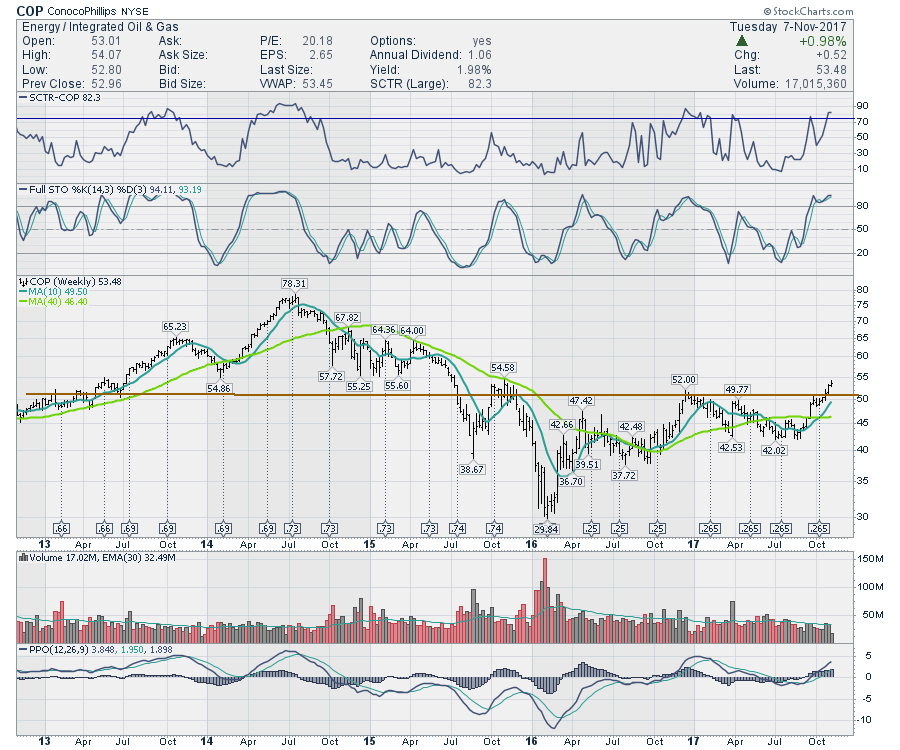
ConocoPhillips (COP) has been on a roll since July, but this week it broke out to new two-year highs. The oil stocks are well positioned to go on a roll. I detailed this in the Commodities Countdown Video Recording 2017-11-02... Read More
Don't Ignore This Chart! November 06, 2017 at 11:19 AM
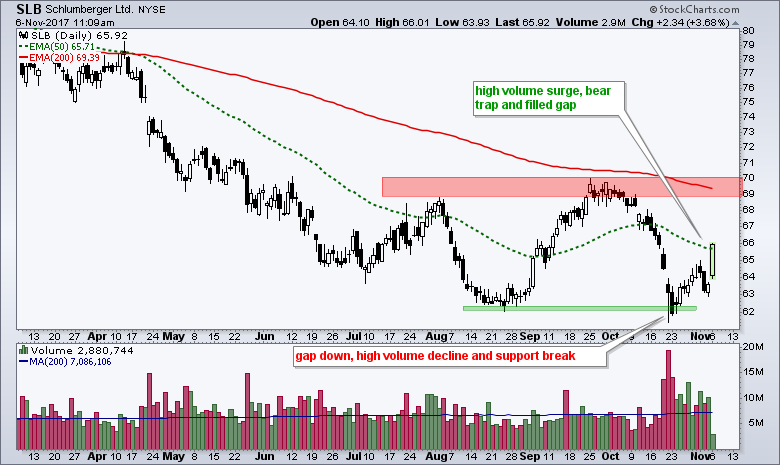
Schlumberger (SLB) broke support with a surge in volume, but this support break did not hold as the stock surged with strong volume the last two weeks. The decline below 62 looks like a selling climax because of high volume and the gap down... Read More
Don't Ignore This Chart! November 04, 2017 at 02:33 PM
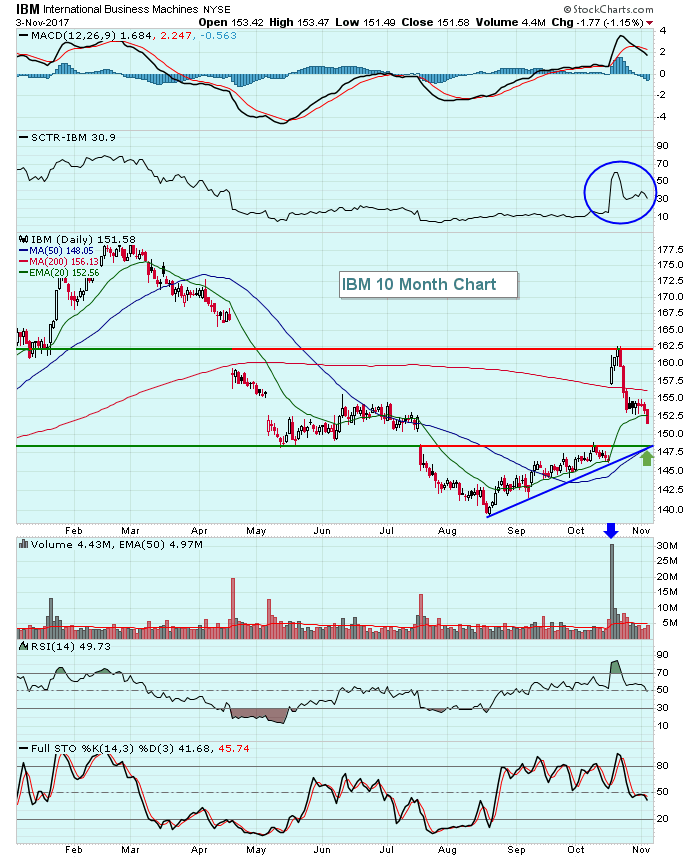
IBM has been a very interesting stock to watch, but not to own. After 23 consecutive quarters of declining revenues, traders finally found something to be excited about in IBM's latest quarterly earnings report. Five years ago, IBM traded near 165... Read More
Don't Ignore This Chart! November 03, 2017 at 06:51 AM
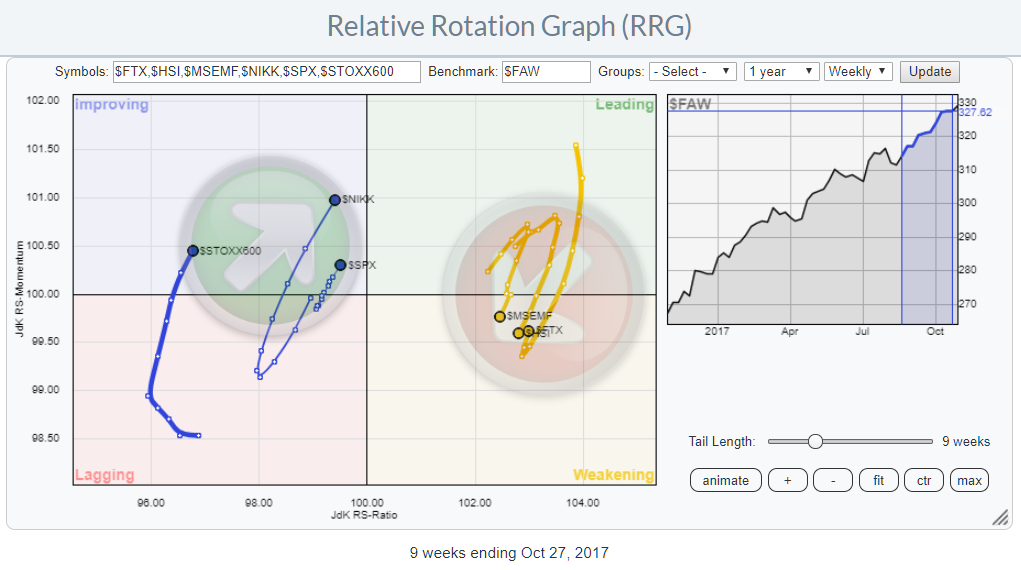
The Relative Rotation Graph above plots a number of world equity markets against the FTSE all-world index and shows their relative rotation around this benchmark... Read More
Don't Ignore This Chart! November 01, 2017 at 08:51 AM
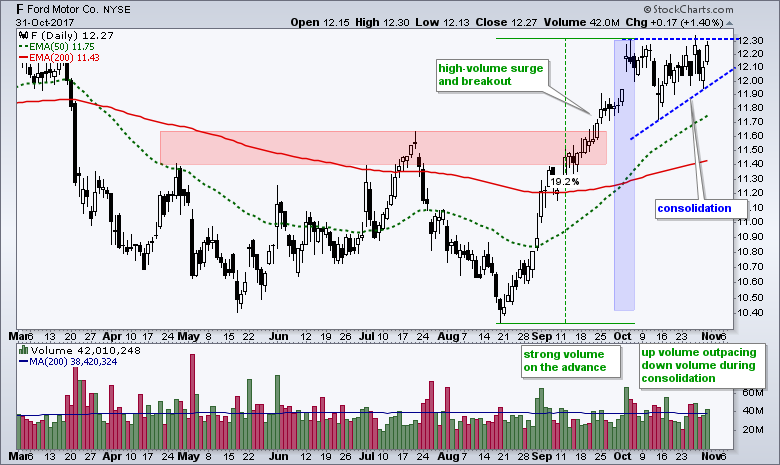
Ford (F) consolidated after a big advance and this consolidation looks like a bullish continuation pattern. First, industry group strength and the long-term uptrend are in Ford’s favor... Read More
Don't Ignore This Chart! October 31, 2017 at 09:53 PM
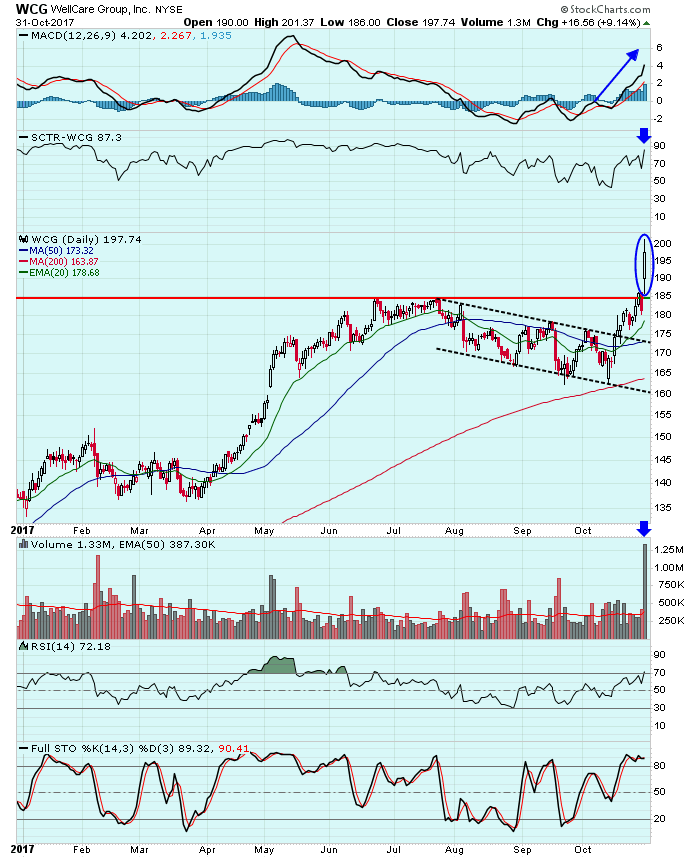
WellCare Group (WCG) posted quarterly earnings that beat Wall Street consensus estimates and the stock soared above recent price resistance. Volume surged as traders accumulated the healthcare provider. The Dow Jones U.S... Read More