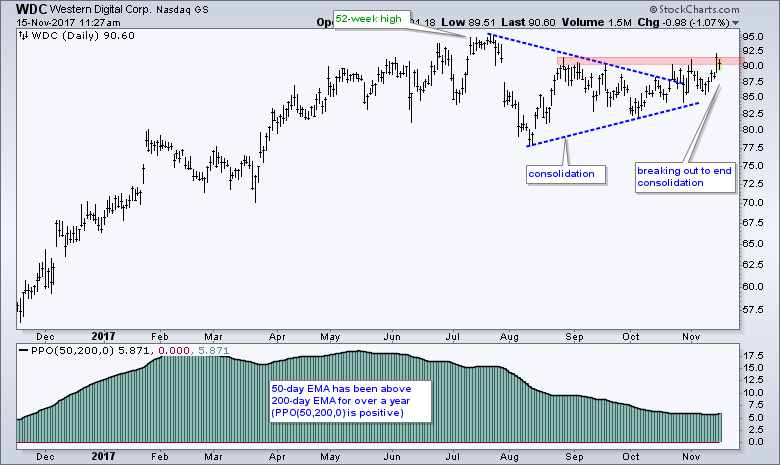
Western Digital (WDC) appears to be emerging from a consolidation pattern and this increases the chances of new highs in the coming weeks. The chart shows WDC hitting a new high in July and then falling with a rather sharp decline into early August. The stock immediately rebounded after this decline, but then traded sideways as a triangle formed. This triangle is basically a consolidation within an uptrend and a breakout means the bigger uptrend is continuing. Note that the 50-day EMA has been above the 200-day EMA for over a year now. WDC struggled to break the triangle trend line in late October, but buying pressure increased over the last six days as the stock edged above the August high. A resistance breakout is in the making and this means WDC is poised to challenge its July high.
Follow me on Twitter @arthurhill - Keep up with my 140 character commentaries.
****************************************
Thanks for tuning in and have a good day!
--Arthur Hill CMT
Plan your Trade and Trade your Plan
*****************************************
