Don't Ignore This Chart! February 28, 2018 at 11:41 AM

The Consumer Staples SPDR (XLP) is one of the worst performing sectors year-to-date with a loss greater than 8 percent. The sector is also the second weakest in February because it failed to hold its bounce over the last two weeks... Read More
Don't Ignore This Chart! February 27, 2018 at 09:10 AM
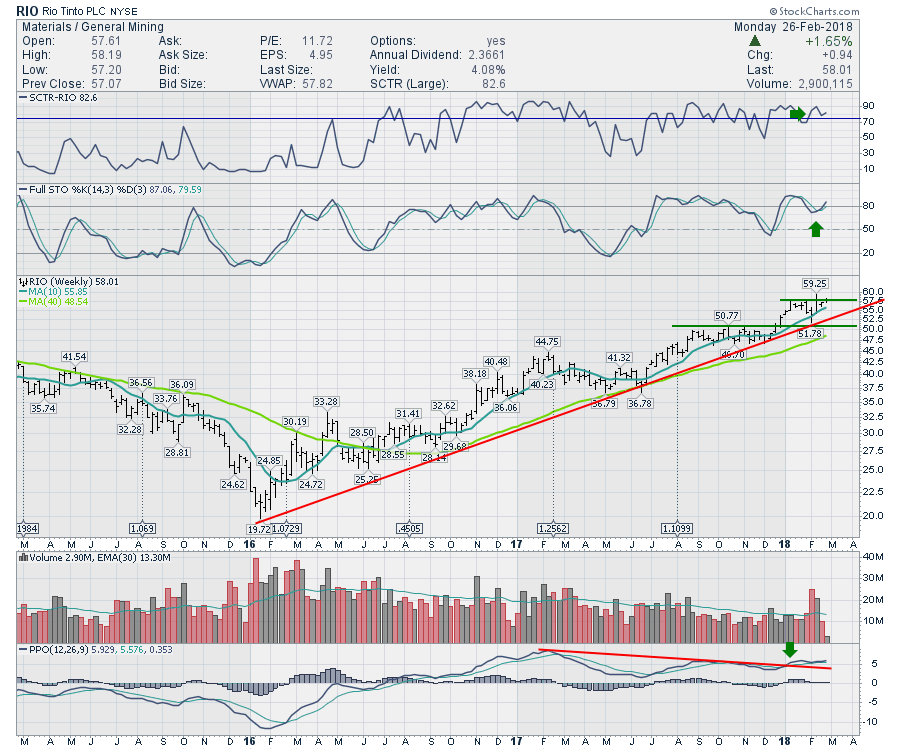
The global miners have been rolling pretty well lately. They also rolled over with the general market. Rio Tinto rolled over 15% and has come bouncing back, trying to take out the previous highs today. This is an important bounce... Read More
Don't Ignore This Chart! February 26, 2018 at 11:27 AM

Humana (HUM) is part of the HealthCare Providers ETF (IHF) and this group led the market from mid-October to late January with a 20+ percent surge to new highs. The group pulled back in February, but the long-term trend is up and this bodes well for stocks in the group... Read More
Don't Ignore This Chart! February 25, 2018 at 09:54 PM
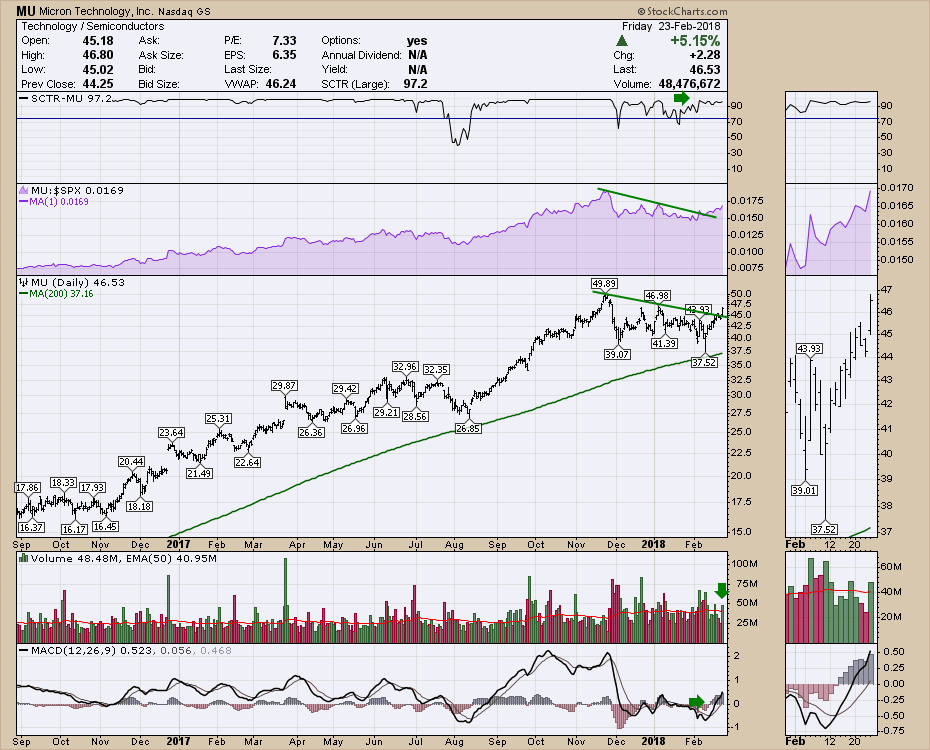
After the pullback in February, it is apparent that technology is still a strong area of the market. The chart of Micron (MU) looks real strong here after bouncing off the 200 DMA. It also sports a couple of great technical features... Read More
Don't Ignore This Chart! February 21, 2018 at 12:06 PM

Even though I am currently in the "correction" camp for the broader market, there are clearly pockets of strength in some key groups... Read More
Don't Ignore This Chart! February 20, 2018 at 09:09 PM
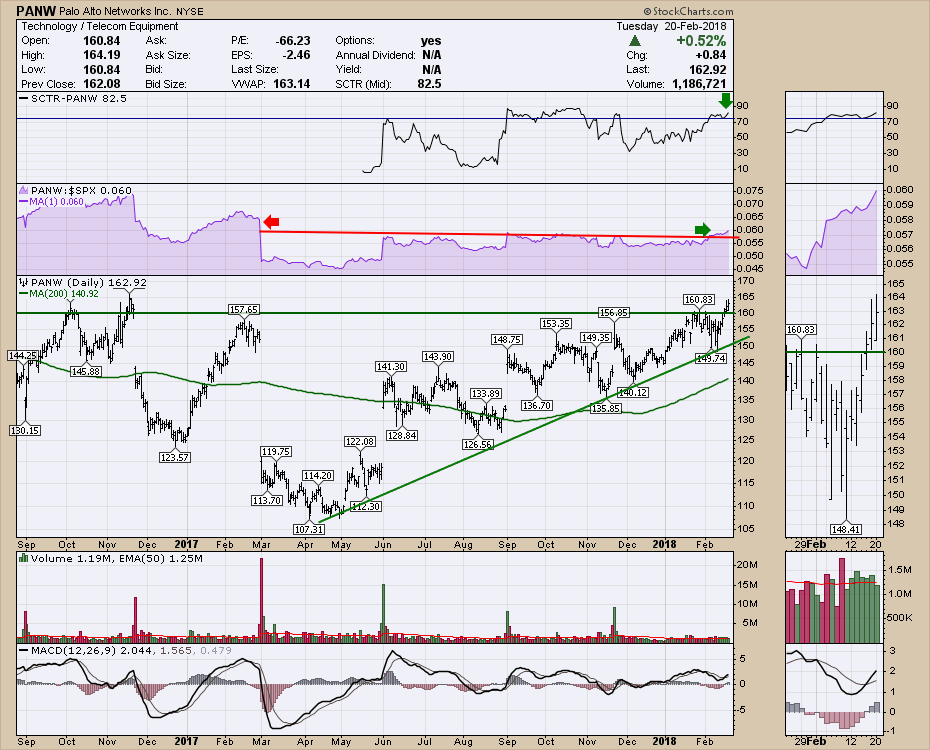
Palo Alto Networks (PANW) has been climbing nicely off a huge gap down on earnings in late February 2017. Unfortunately for the investor it has been a round trip back to the beginning... Read More
Don't Ignore This Chart! February 16, 2018 at 11:42 AM
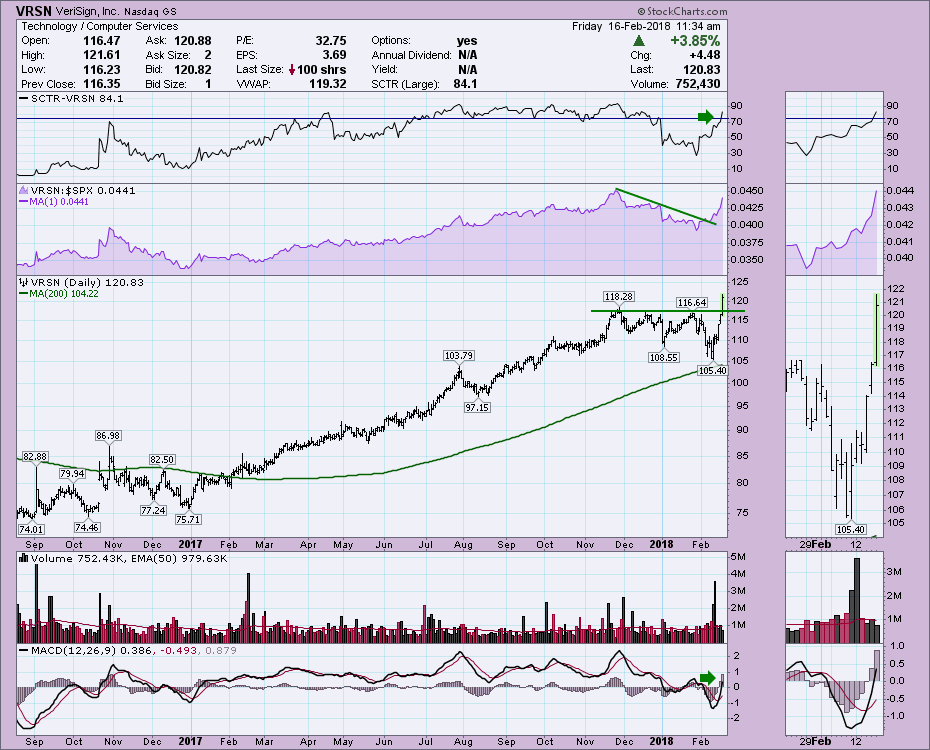
VeriSign (VRSN) is showing signs of a powerful breakout. The SCTR ranking is surging above 75. The Relative strength is making new 2-month highs and not far from its all-time highs... Read More
Don't Ignore This Chart! February 15, 2018 at 11:47 AM
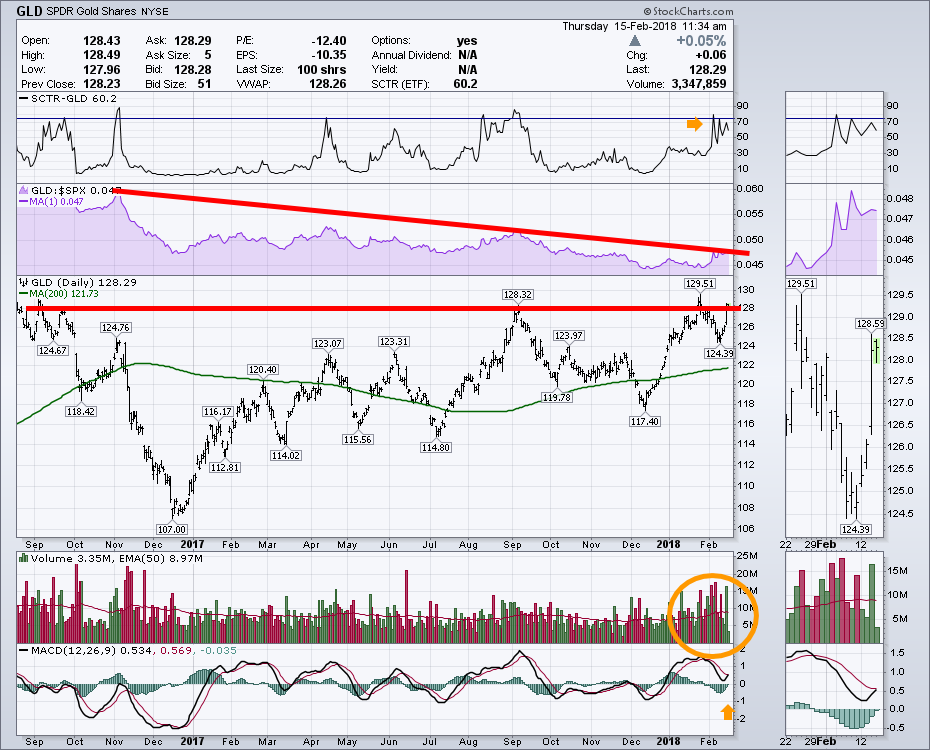
The chart of Gold is getting interesting again. It keeps retesting this level. There are reasons to believe the breakout is at hand. I have used GLD to represent Gold here. The MACD is turning up above zero for the first time in 18 months shown on the chart... Read More
Don't Ignore This Chart! February 14, 2018 at 10:18 AM

There is another disconnect working between the VIX and SPY. The S&P 500 SPDR (SPY) opened weak with a dip below 265, but the S&P 500 Volatility Index ($VIX) also declined. This is an interesting dynamic because the VIX usually moves opposite of SPY... Read More
Don't Ignore This Chart! February 12, 2018 at 09:36 AM
The CME Group (CME), which has a number of volatility-based futures products, runs a variety of futures and options exchanges including the CME, CBOT, NYMEX and COMEX. While the S&P 500 fell 8.82% over the last two weeks, CME Group actually gained ground and advanced 1.09%... Read More
Don't Ignore This Chart! February 10, 2018 at 10:00 AM
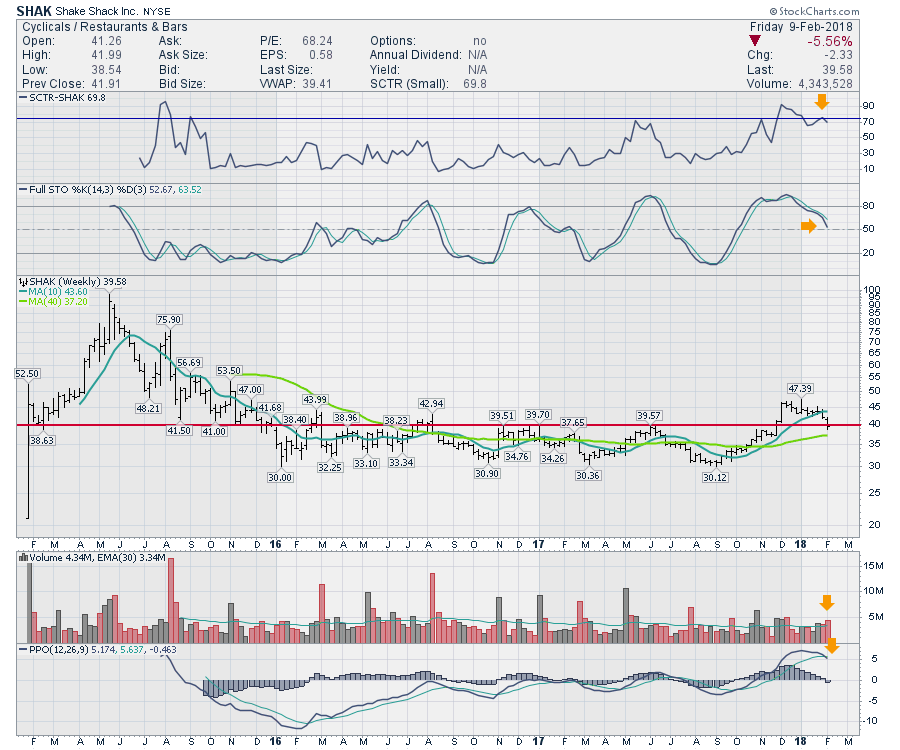
Shake Shack (SHAK) has been an interesting story. The stock IPO'd as a parabolic stock, then fell out of the sky. That's kind of how parabolic stocks go. But in 2017, Shake Shack started to show up on the radar again. Shake Shack Starts Shaking... Read More
Don't Ignore This Chart! February 09, 2018 at 08:09 PM
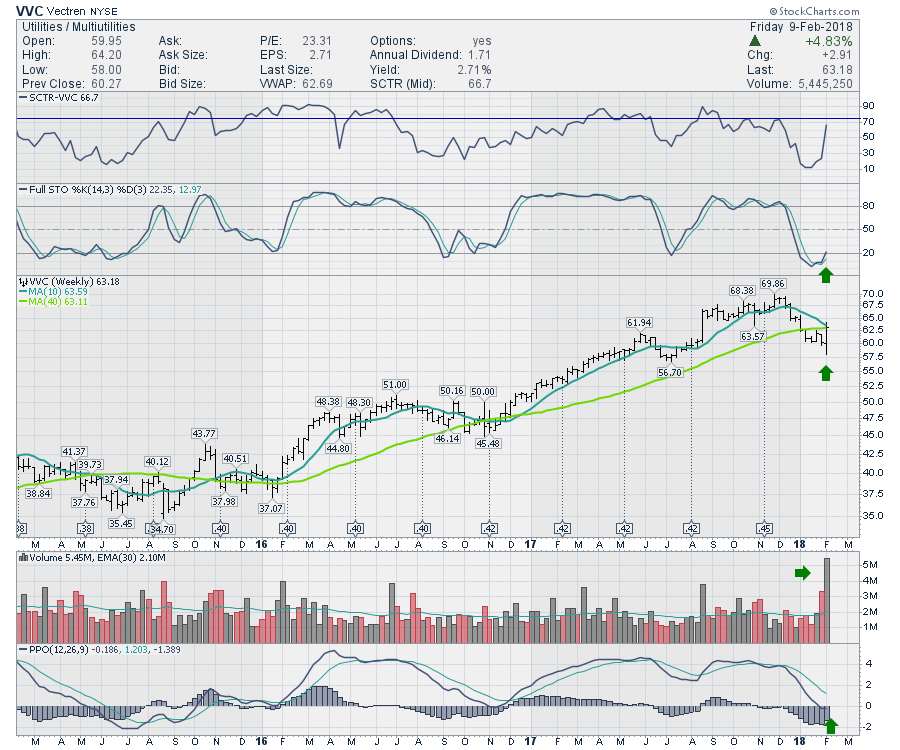
Vectren (VVC) has been in a great uptrend. With the recent market pullback, it also came in a little. However, today kicked in one of my favorite signals. The price turned up the Weekly Stochastic on the second panel... Read More
Don't Ignore This Chart! February 07, 2018 at 11:51 AM

Intel (INTC) was hit hard the first three days of February, but the stock managed to hold support with a high volume reversal over the last three days... Read More
Don't Ignore This Chart! February 06, 2018 at 07:02 PM
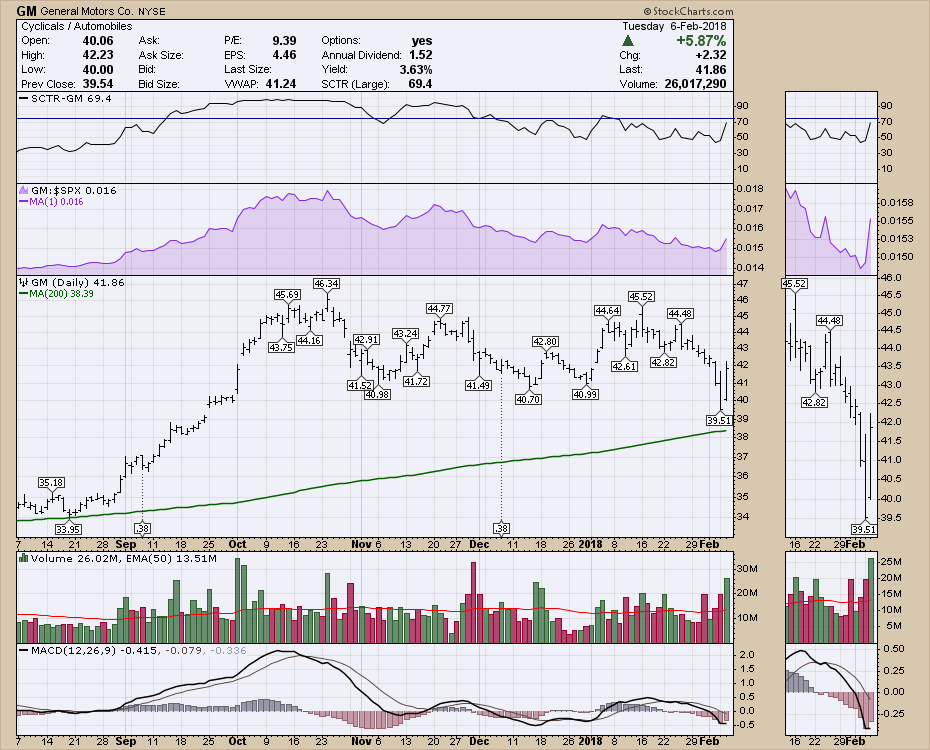
GM had a nice bullish reversal today along with the market. The fact that it took out yesterday's high when the overall market only made half of the previous loss (600 up vs. 1175 down) suggests good energy here. A tight stop at $41 is probably in order... Read More
Don't Ignore This Chart! February 05, 2018 at 11:50 AM

The stock market was hit with hard selling pressure last week, but Palo Alto Networks (PANW) held up rather well and move below its breakout zone. Stocks that hold up best during a broad market correction are often the ones that lead on the rebound... Read More
Don't Ignore This Chart! February 02, 2018 at 11:10 AM
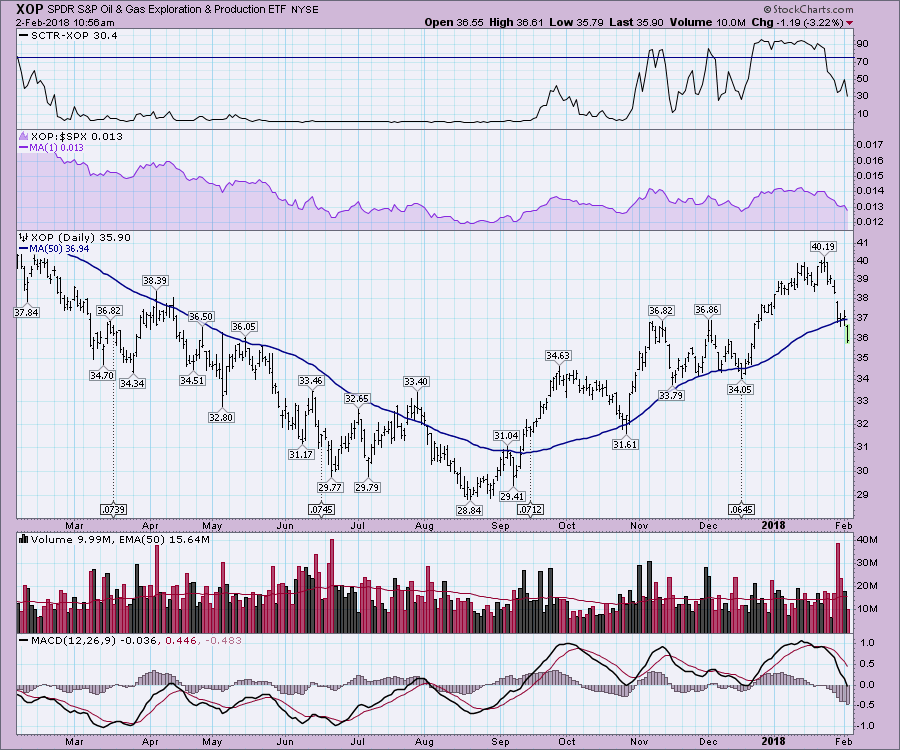
The Exploration and Production ETF (XOP) has shown a level of respect for the 50 day moving average (DMA) over the last year. From February 2017 to August 2017 it stayed below the 50 DMA. From September 2017 to January 2017 it stayed above the 50 DMA... Read More
Don't Ignore This Chart! February 01, 2018 at 05:47 PM
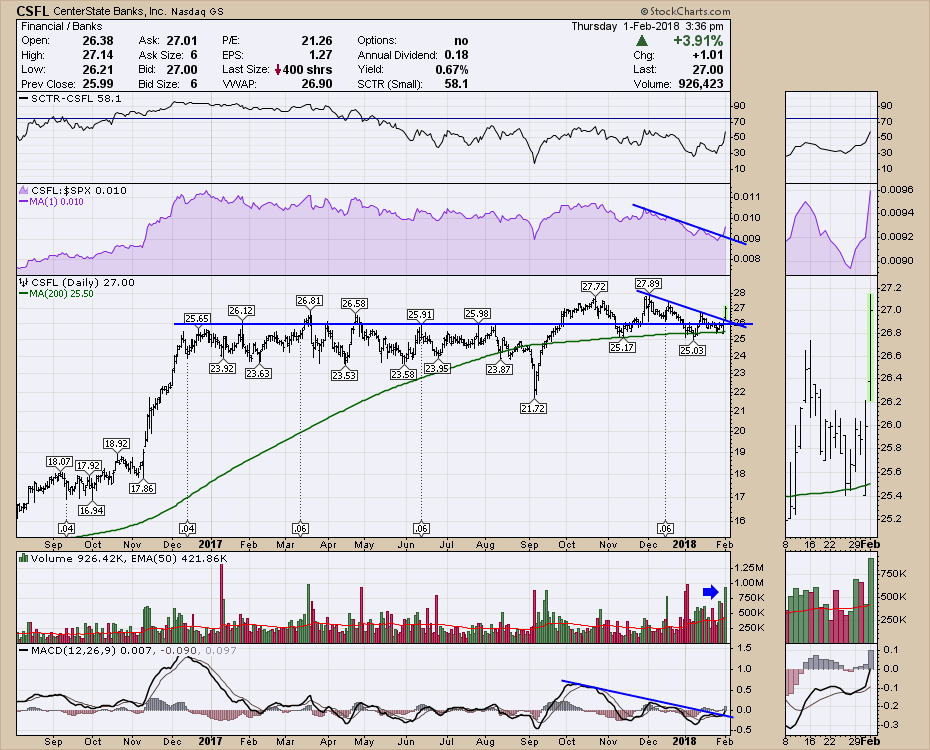
CenterState Banks (CSFL) showed up on the Parabolic predefined scan today. With a really nice high volume push off support, the stock looks set to break above the table top it has built over the last year. This $26 level has been hard to push through... Read More