 The S&P 500 was shaken with a plunge below its 200-day SMA on Friday and this gives chartists a reference point to compare with other charts.
Personally, I do not think moving averages represent support or resistance levels. Moving averages provide price points that chartists can use to gauge the trend and compare performance.
The chart below shows Ross Stores (ROST) just below its falling 50-day SMA, but well above its rising 200-day SMA. This suggests that the medium-term trend is down and the long-term trend is up.
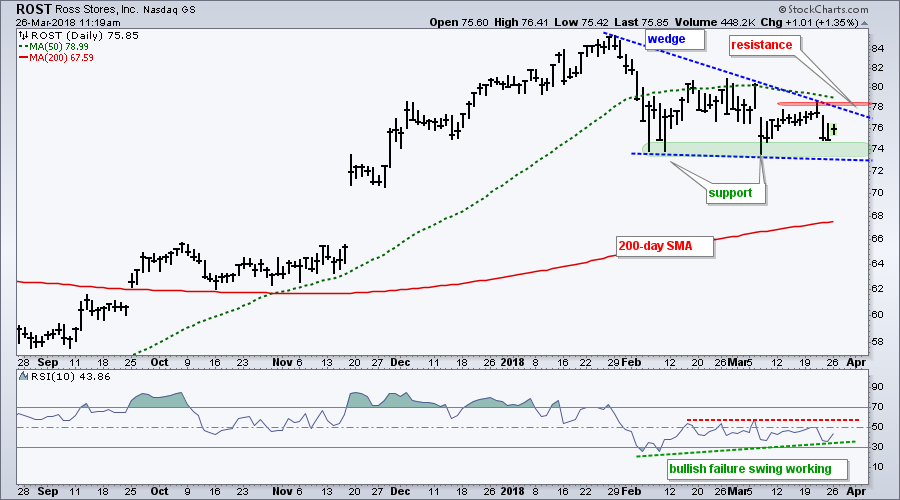
Comparing to the S&P 500, ROST is stronger because it is well above its 200-day SMA. The S&P 500, in contrast, is trading near this same SMA. Also note that ROST is finding support at the mid March low, but the S&P 500 broke below this low.
A falling wedge is taking shape and this is typically a corrective pattern within a bigger uptrend. The wedge line and late March high define the fall so chartists can watch these levels for a breakout to reverse the medium-term downtrend.
The indicator window shows RSI(10) dipping below 30 in early February, bouncing back to the 50 area and then falling back. Notice that RSI has yet to move back below 30 and this means a "bullish failure swing" is forming. It is basically a higher low without dipping back below 30 (oversold).
Note that a bullish failure swing as nothing to do with the price of the underlying. In other words, a divergence is not required.
The bullish failure swing would be confirmed should RSI break above the mid March high (60). This would trigger a momentum breakout and be bullish.
Plan Your Trade and Trade Your Plan.
- Arthur Hill, CMT
Senior Technical Analyst, StockCharts.com
Book: Define the Trend and Trade the Trend
Twitter: Follow @ArthurHill
