Bond prices are rolling over at a critical place on the charts. This sends yields higher. The big 5 year picture shows the delicate place where the bonds prices are falling. It is a perfect head/shoulders top with declining momentum on each push up. This is shown on the MACD. Also, notice the MACD gave a sell signal on Friday's close and closed below the 10 Week Moving Average.
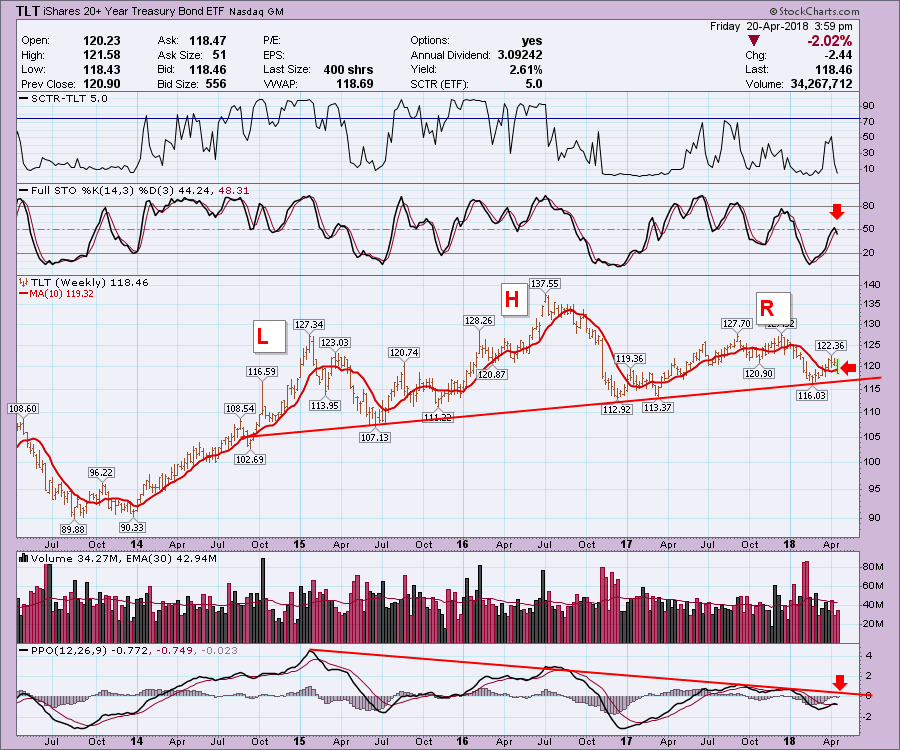
While normally this 'bond prices are breaking down' narrative would just be more noise for the market, we can see the slimmest of margins before this price action will complete a major 4-year head/shoulders top.
Watch closely to see if financial stocks react positively or negatively to the breakdown in bond prices. This could also have a huge effect on the broader equity markets. If we do break down, watch to see if the broader equity markets start to fall as well. When currencies crack and bond markets break huge trend lines, it may mark a change in trend for equities as well. So Don't Ignore This Chart!
Here is a link to a recording of my new live show on StockCharts TV. The Final Bar with Greg Schnell. This weeks show points out how acute the settings are for currencies, commodities, bonds and equities.
I have also recorded a new Commodities Countdown. You can find that video here.
Good trading,
Greg Schnell, CMT, MFTA
