 The S&P 500 is well below its January high and trading near its February low. DSW, in contrast, hit a 52-week high last week and is clearly leading the market.
The chart shows DSW with a choppy advance from mid August to mid November and then a choppy consolidation. The consolidation narrowed over the months and a large symmetrical triangle formed.
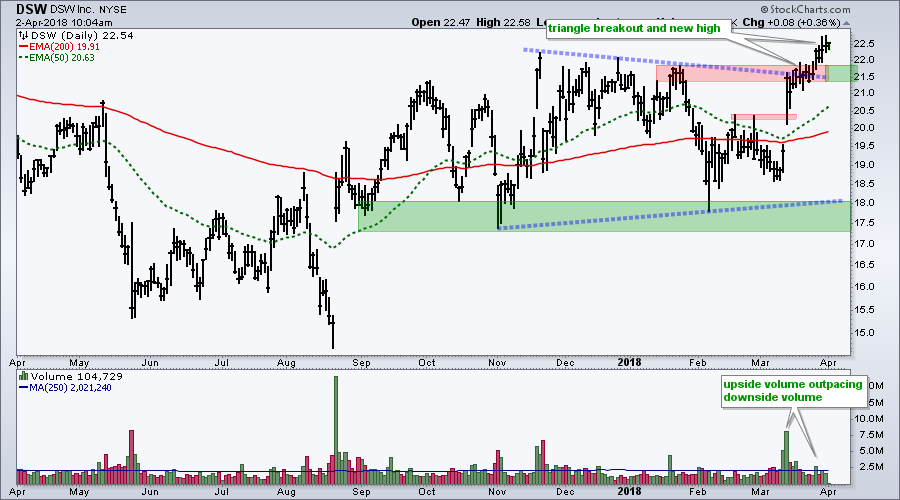
DSW gapped up and broke resistance within the triangle in mid March. Notice that this internal breakout occurred on big volume. The stock continued higher after the surge and upside volume continued to outpace downside volume.
DSW transitioned to a long-term uptrend with the combination of an upside breakout and 52-week high. The resistance zone turns into the first support zone to watch on any pullback.
Plan Your Trade and Trade Your Plan.
- Arthur Hill, CMT
Senior Technical Analyst, StockCharts.com
Book: Define the Trend and Trade the Trend
Twitter: Follow @ArthurHill
