The energy sector has been a roller coaster of emotions with very little profit showing up for investors. The whipsaws have been large.
This week the energy charts changed complexion as oil proceeded to break out. One stock that is showing up on the radar is Suncor Energy. While lots of energy stocks are still near the 2016 lows, this stock it trying to push to all time highs.
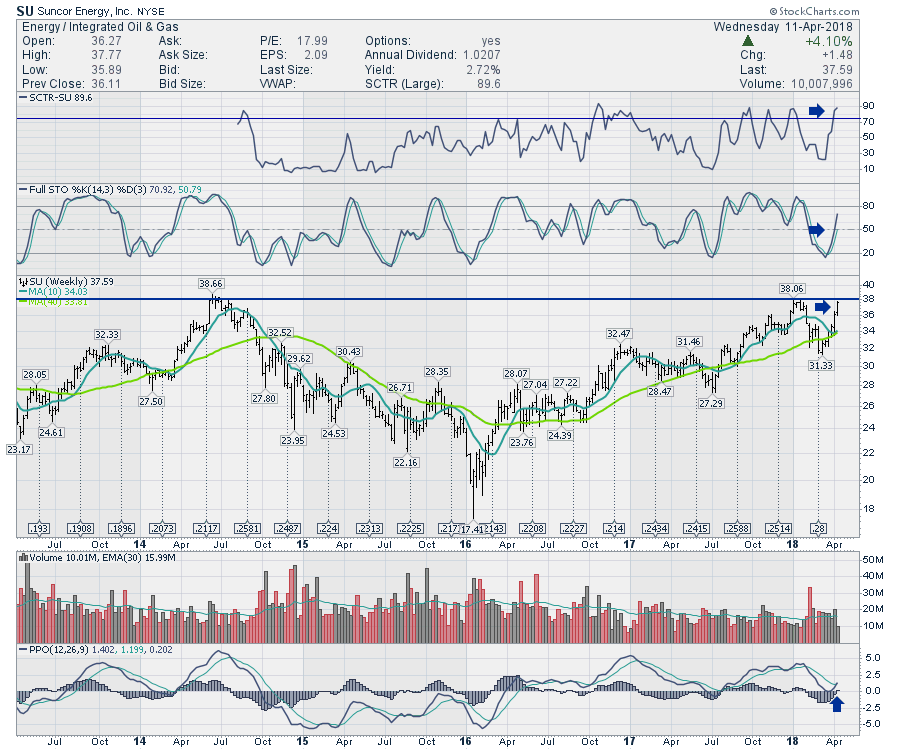 The SCTR shows Suncor up near 90, suggesting excellent price action. The weekly full stochastics have been rising since the late February lows. Suncor price action is particularly impressive. After testing the new highs level in January, the stock pulled back to horizontal support at $32. From there, it continued to push higher. The recent price pullback set the PPO back to reset around zero and it is just turning up above the signal line suggesting lots of room to move higher.
With the whole energy sector starting to perk up, there are lots of nice charts. I'll be covering more this week with the Commodities Countdown so feel free to check out the video and the blog.
Good trading,
Greg Schnell, CMT, MFTA
