The Gambling industry group has been performing well as of late. This week the chart of Las Vegas Sands (LVS) is attempting to break to new highs. Technically, the stock is performing well. The SCTR is above 75, and the Relative Strength in purple shows LVS outperforming the $SPX. The recent consolidation since the beginning of the year looks like it is just setting up for the next leg higher.
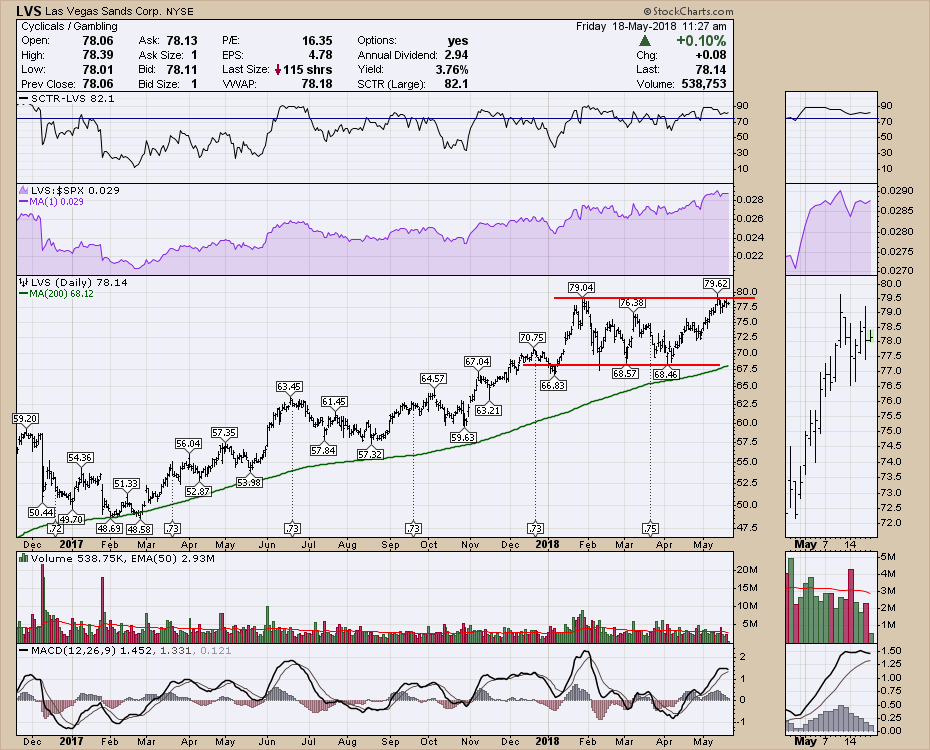
The MACD looks extended here and the stock might need to pull back for a few days which might make for a safer entry. The consolidation range is $10 which would target a measured move towards $89 on a breakout.
I host a new TV show on StockCharts.com called The Final Bar. It airs Thursdays at 5 PM ET and is repeated throughout the week on StockCharts TV. You can also catch it on my Vimeo channel or on the StockCharts.com YouTube Channel.
Good trading,
Greg Schnell, CMT, MFTA
Senior Technical Analyst, StockCharts.com
Book: Stock Charts for Dummies
Twitter: Follow @Schnellinvestor
