Don't Ignore This Chart! July 30, 2018 at 11:15 AM
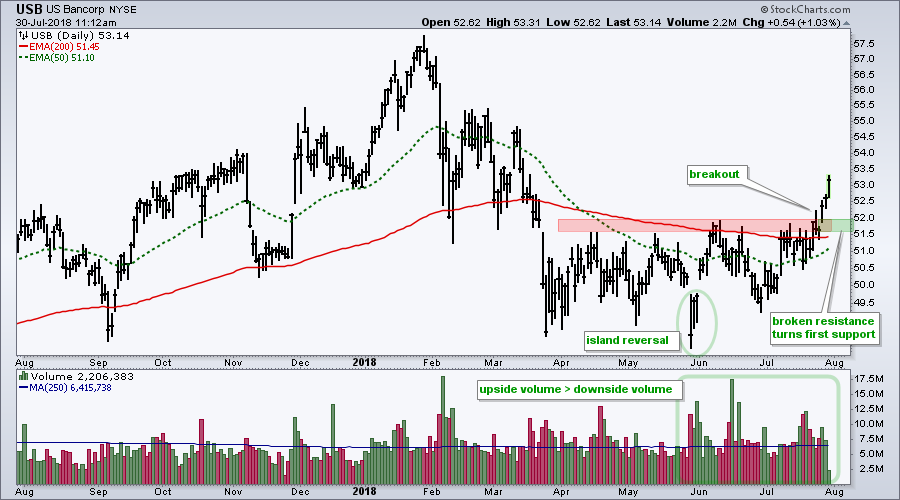
US Bancorp lagged the broader market the first half of the year, but managed to firm from March to June and lead with a breakout in July. The chart shows USB falling from 57 to 49 with a sharp decline from late January to late March... Read More
Don't Ignore This Chart! July 26, 2018 at 08:14 PM
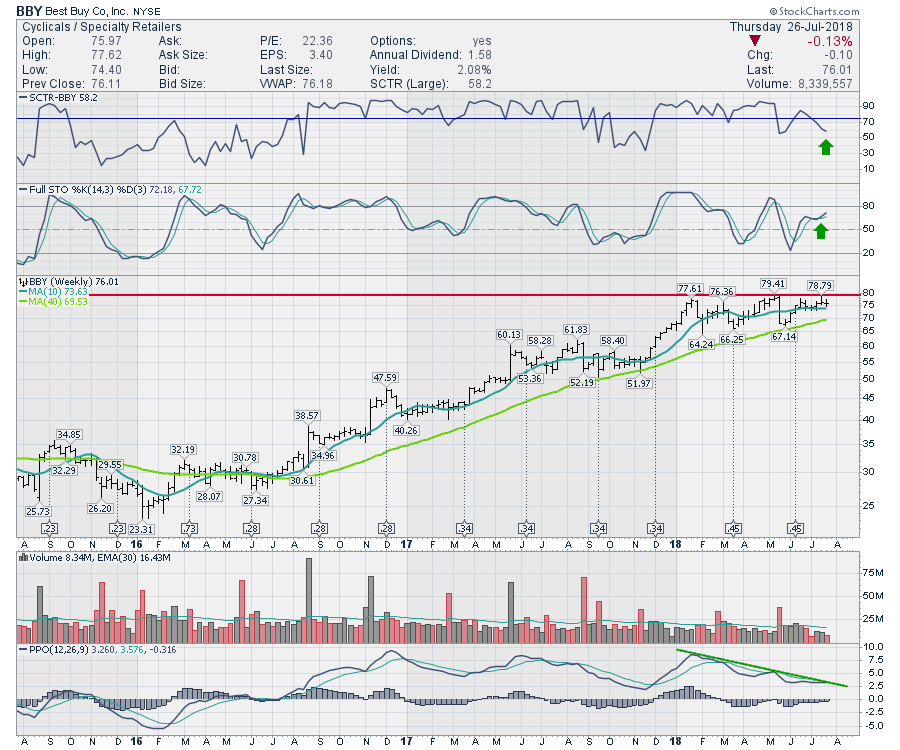
Best Buy (BBY) was all but thrown out in the retail washout a few years ago. 2017 was a huge year for the stock. In 2018, the stock has consolidated all year. Now Best Buy sits just below a buy point on a breakout trade plan... Read More
Don't Ignore This Chart! July 25, 2018 at 08:04 AM

Danaher is part of a strengthening sector (healthcare) and accounts for around 5.5% of the Medical Devices ETF (IHI), which is one of the strongest industry group ETFs this year... Read More
Don't Ignore This Chart! July 24, 2018 at 11:32 PM
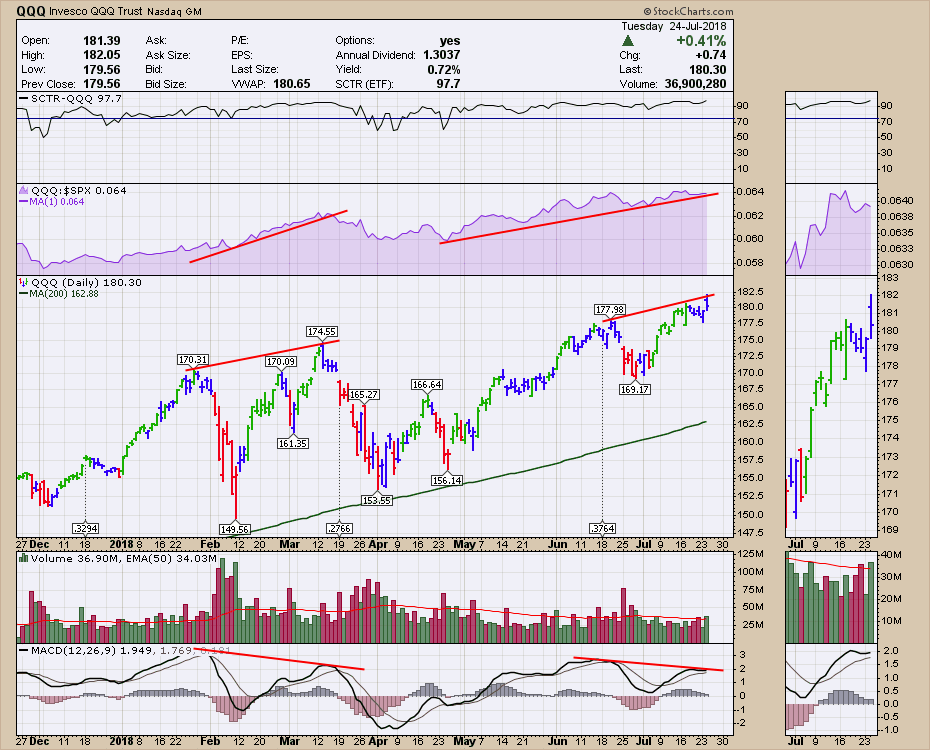
The Nasdaq 100 tracking ETF (QQQ) suffered a rough day today. It closed higher but without question the afternoon showed signs of the bullish trend weakening. After a strong gap up in the morning on Alphabet's earnings backdrop, the intraday chart rolled over quite hard... Read More
Don't Ignore This Chart! July 23, 2018 at 03:24 PM

Honeywell (HON) kicked off earnings season for the big industrial stocks last week and surged on high volume. The stock is already in a long-term uptrend and the correction in the first half of 2018 appears to be ending... Read More
Don't Ignore This Chart! July 19, 2018 at 08:14 PM

VF Corp is a large cap stock with a wide brand portfolio. It wouldn't be a stretch to imagine at least one of their brands are in every household in North America... Read More
Don't Ignore This Chart! July 18, 2018 at 10:15 AM

I do not use bullish and bearish divergences with momentum indicators very often because they usually form in the direction of the bigger trend. For example, most bearish divergences form in uptrends and most bullish divergences form in downtrends... Read More
Don't Ignore This Chart! July 17, 2018 at 12:49 PM
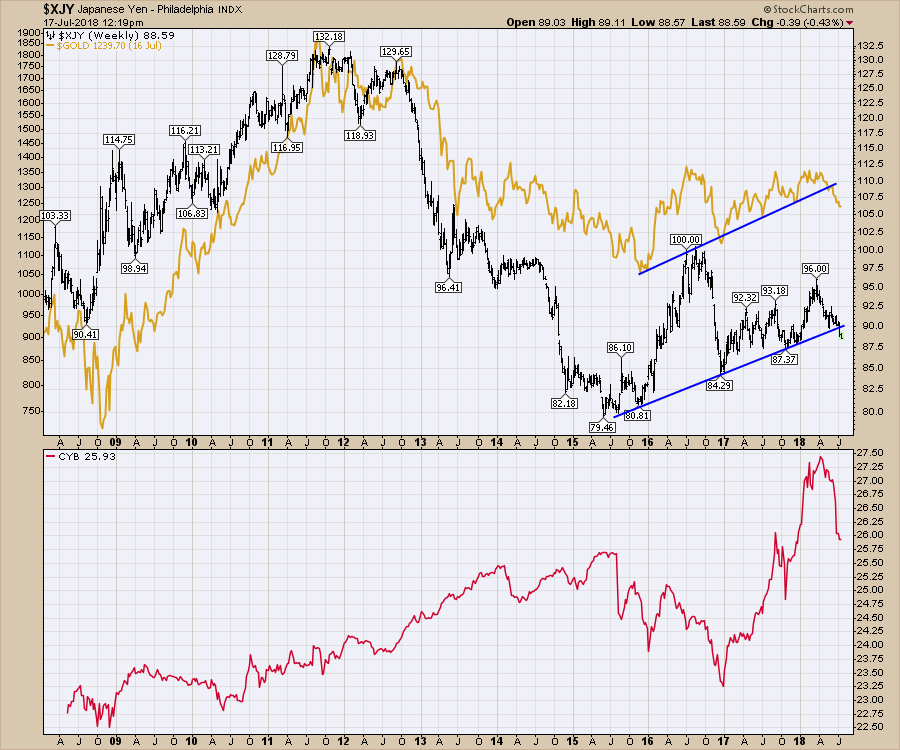
With all the discussion of trade wars, recently the Chinese Yuan and the Japanese Yen have been falling. If a product is made in another country and the currency of that country drops, that makes the product less expensive to import for other countries... Read More
Don't Ignore This Chart! July 15, 2018 at 06:00 PM
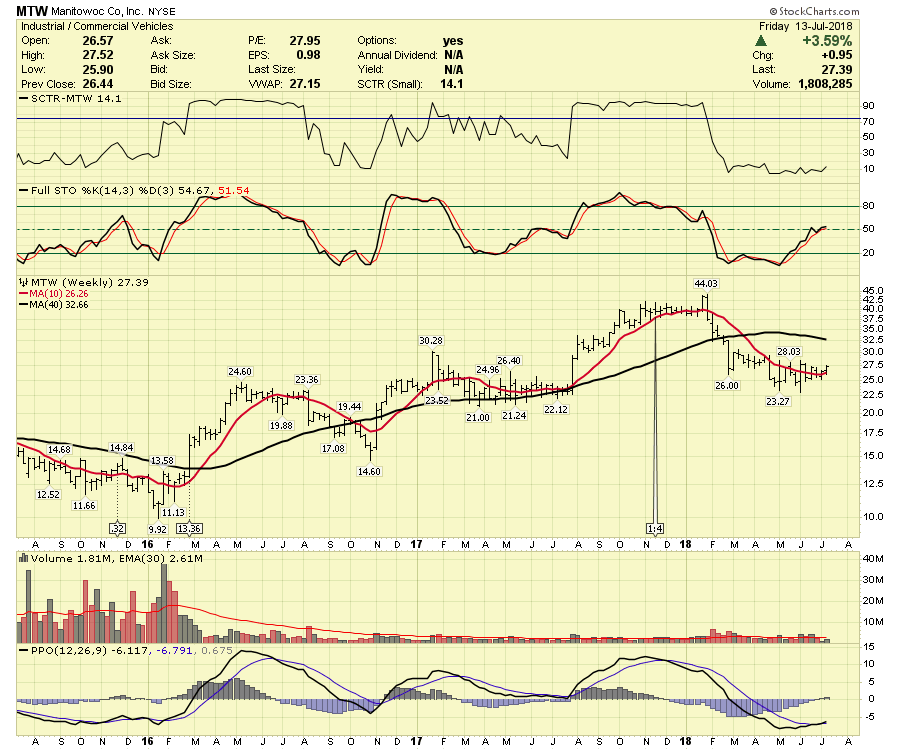
Manitowoc is trying to break the downward trend. There are a few bullish signals on the chart. The Full Stochastic is moving above 50. The PPO is kicking off a buy signal this week... Read More
Don't Ignore This Chart! July 12, 2018 at 06:20 PM
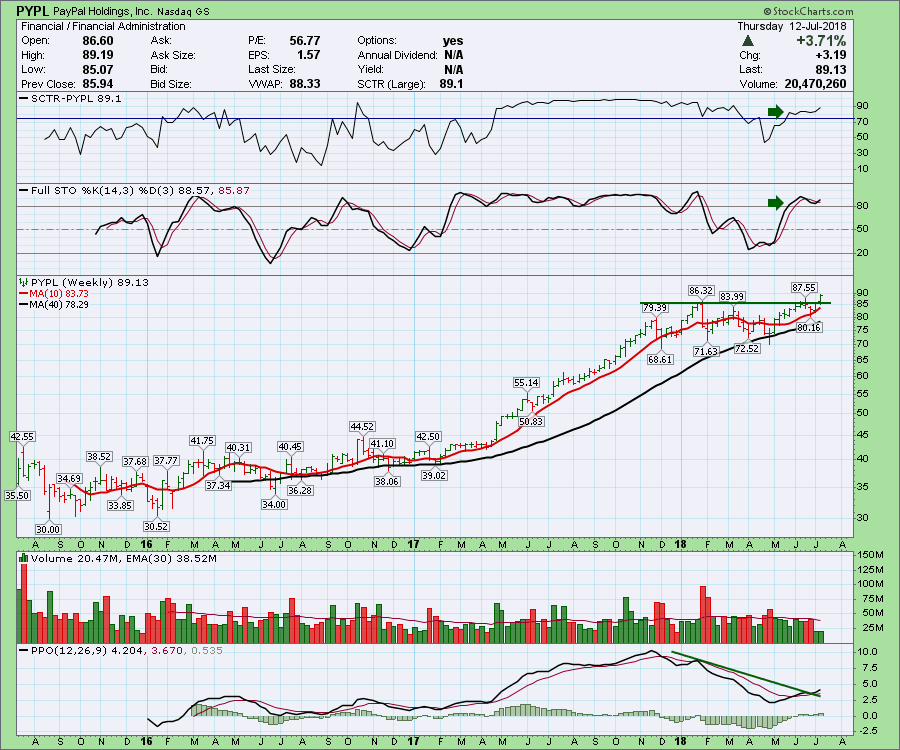
Paypal (PYPL) has been consolidating for 6 months. and this week it is breaking out fresh new highs along with Visa And Mastercard. These are very supportive consolidation patterns... Read More
Don't Ignore This Chart! July 11, 2018 at 09:39 AM
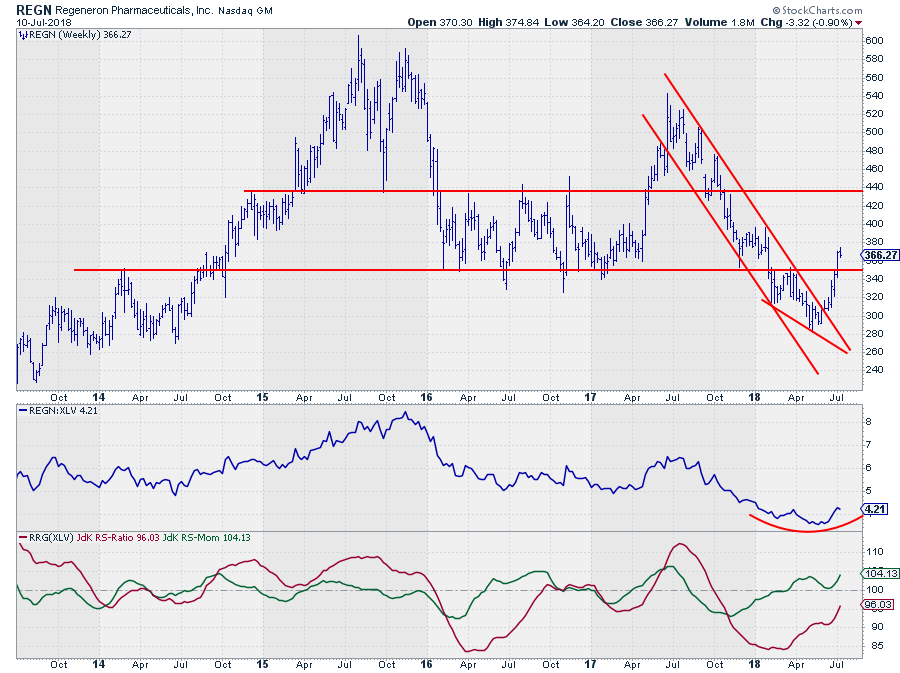
On the Relative Rotation Graph that shows all members of the Health Care sector (XLV) against the XLV benchmark, REGN stands out in a positive way... Read More
Don't Ignore This Chart! July 11, 2018 at 01:18 AM
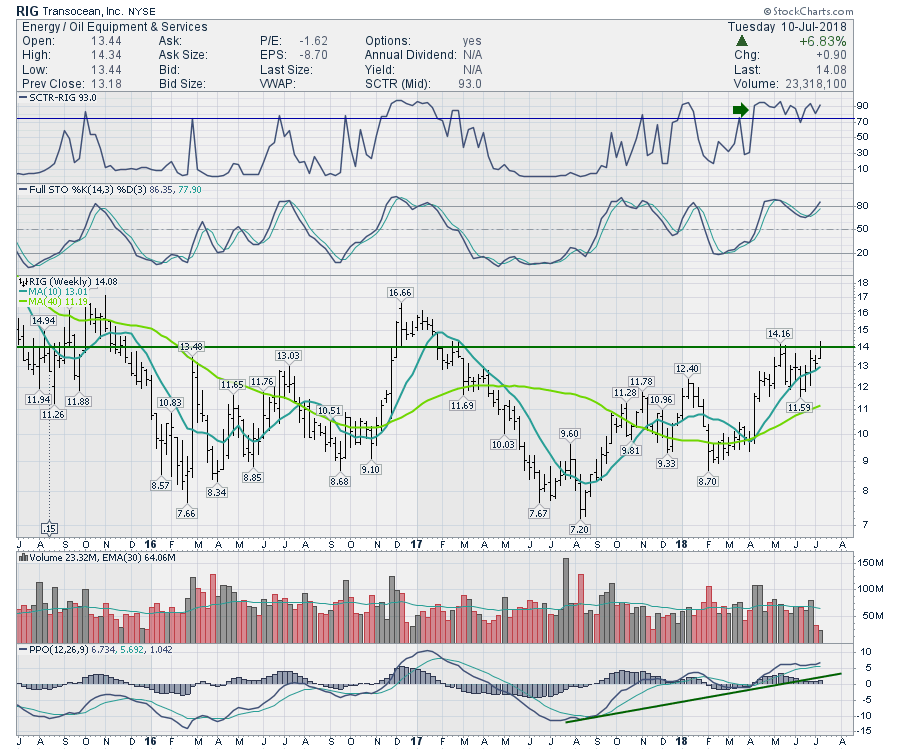
TransOcean (RIG) is starting to hit higher highs and higher lows. This weeks high continues the trend. The SCTR shows the stock being a top performing Mid Cap for the last three months. The full stochastic shows the price staying near the high end of its range... Read More
Don't Ignore This Chart! July 09, 2018 at 10:02 AM
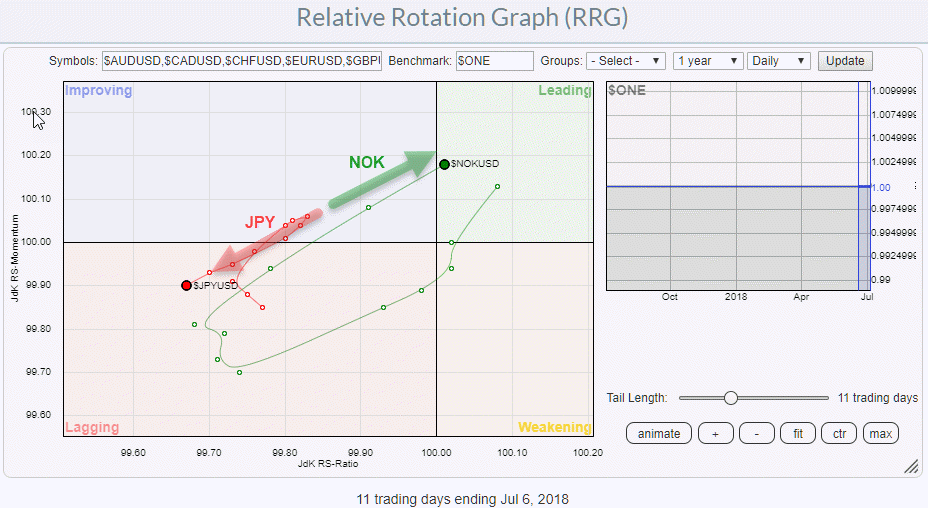
Relative Rotation Graphs are not only used to look at sector-rotation or help with asset allocation decisions but can also help you to pinpoint potential forex trades... Read More
Don't Ignore This Chart! July 09, 2018 at 12:00 AM
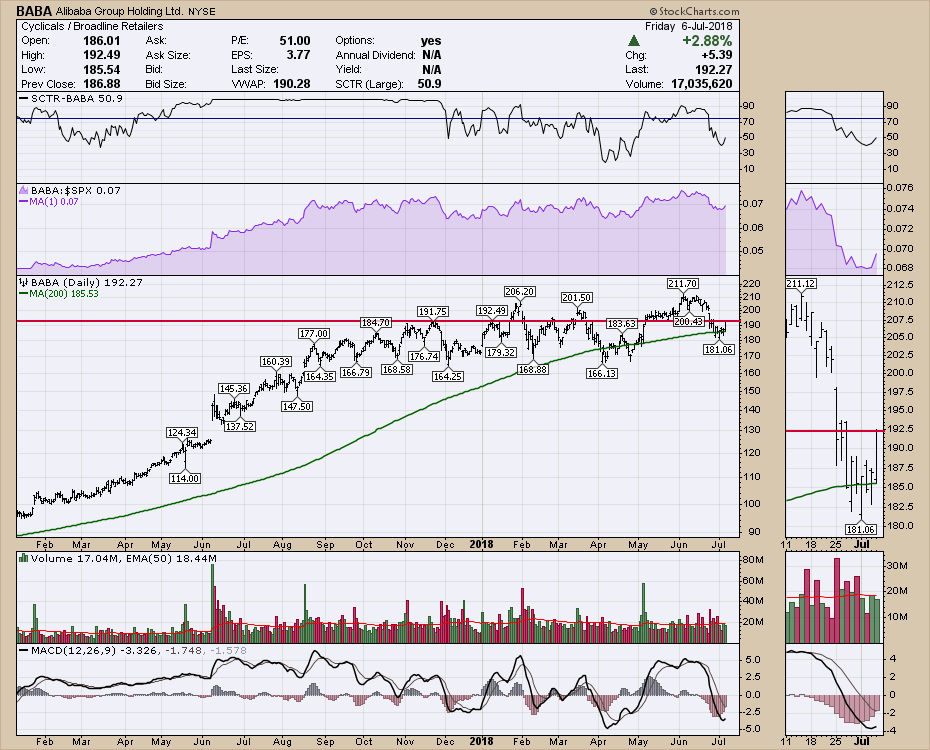
Alibaba has been consolidating for about 9 months after a huge climb in 2017. Friday marked a fresh surge out of a small base around the 200 day moving average. The relative strength has been flat since August of last year. This is shown in the purple area chart... Read More
Don't Ignore This Chart! July 05, 2018 at 07:51 PM
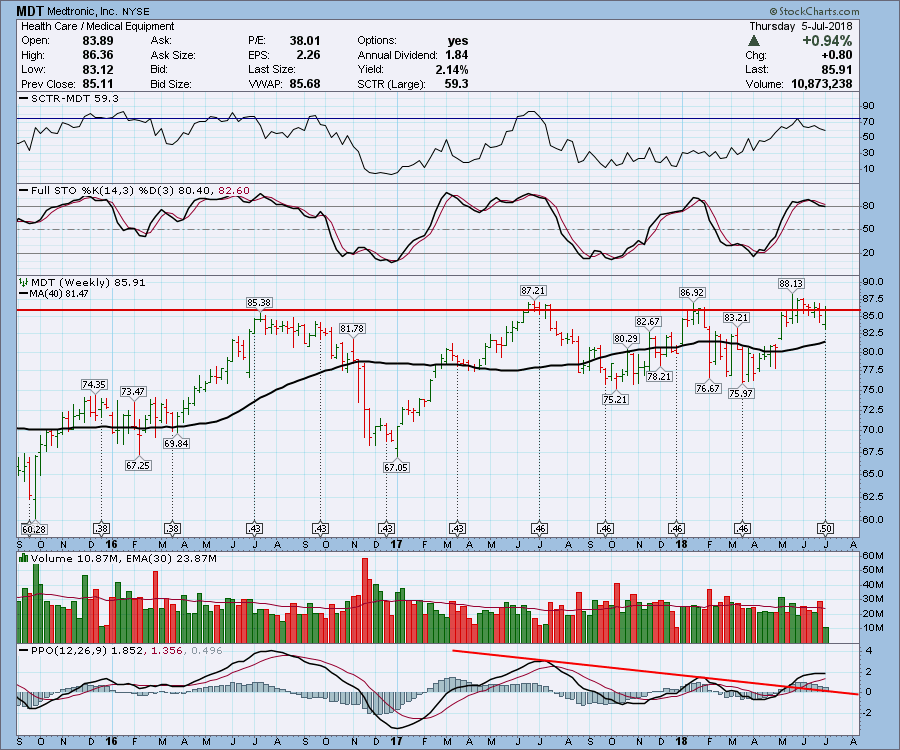
Medtronic (MDT) is a great example of a stock continually retesting the highs. Usually when these patterns break, there is a significant upside move. Medtronic has a two year ceiling that it is fighting to break through... Read More
Don't Ignore This Chart! July 04, 2018 at 08:36 AM
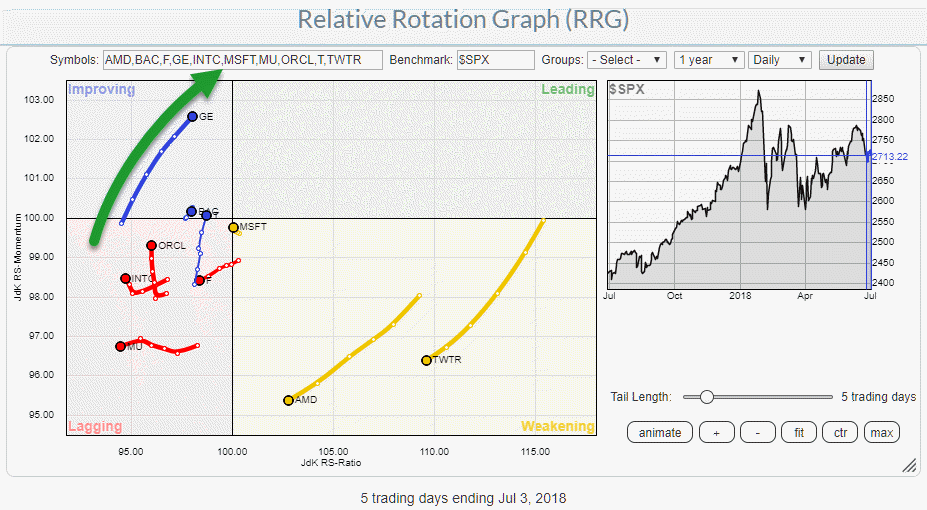
A good start of the day, at least for me is to go to the StockCharts.com dashboard and look at the Top 10, most active, market movers, in the S&P 500 index. The table gives a quick idea of what has happened the previous day... Read More
Don't Ignore This Chart! July 03, 2018 at 09:56 AM
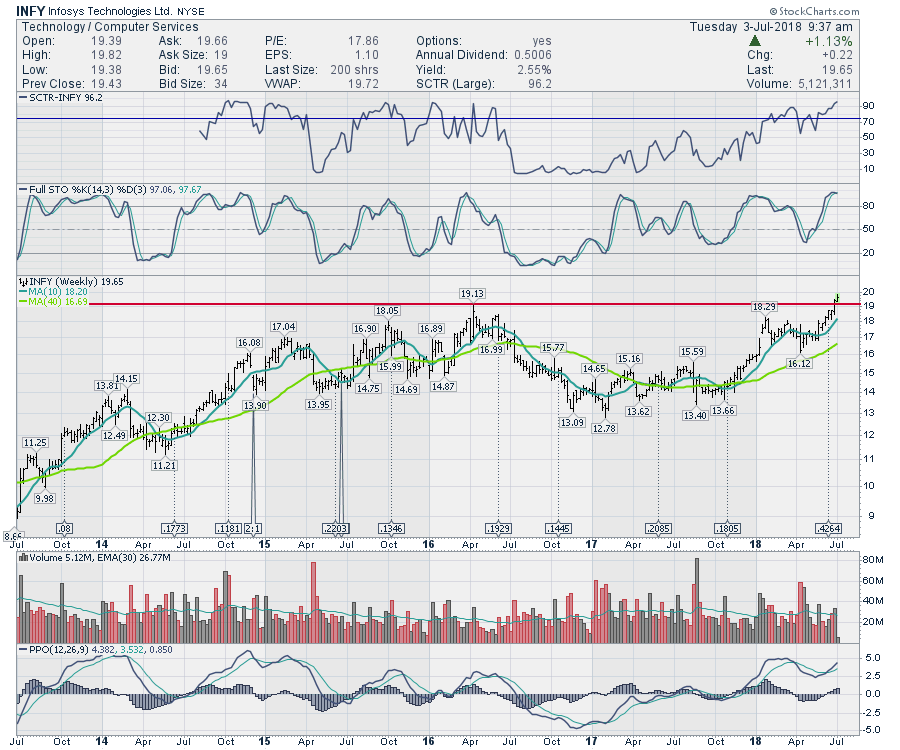
Infosys (INFY) Is breaking out to new highs this week. Last week it closed in new high territory even while the overall market was pulling back. Nice to see the relative strength... Read More
Don't Ignore This Chart! July 02, 2018 at 04:50 AM
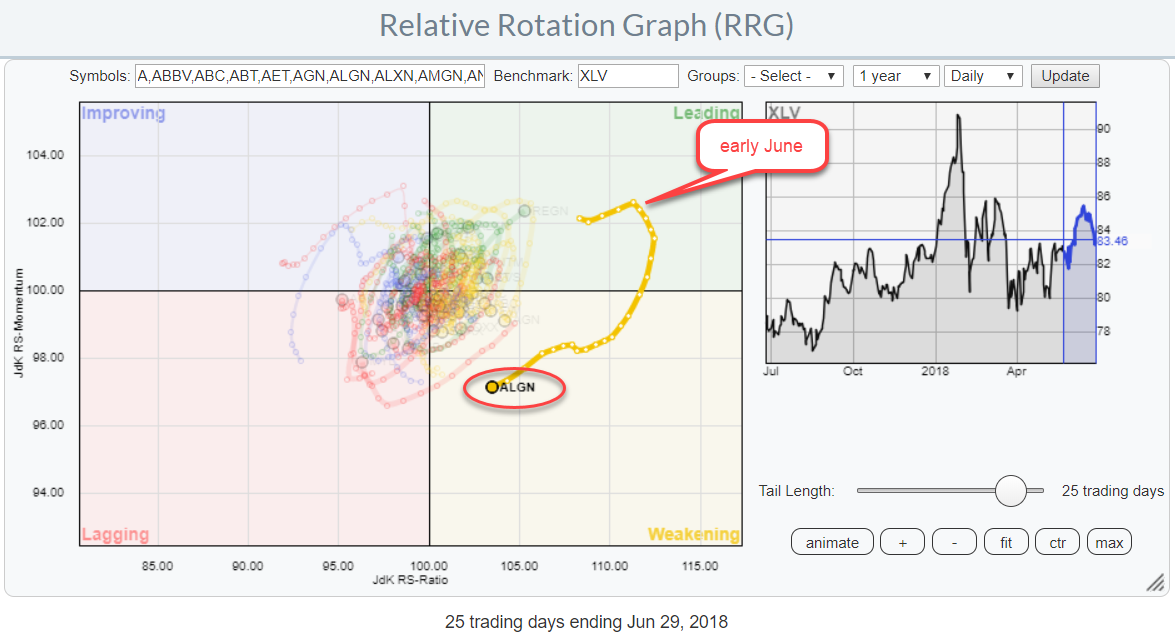
This (DAILY) Relative Rotation Graph shows the rotation of the Health Care stocks against their XLV benchmark. One stock really stands out because of its wide rotation... Read More