The Nasdaq 100 tracking ETF (QQQ) suffered a rough day today. It closed higher but without question the afternoon showed signs of the bullish trend weakening. After a strong gap up in the morning on Alphabet's earnings backdrop, the intraday chart rolled over quite hard. What makes this a little more difficult is that the momentum shown by the MACD is lower currently than on the June high. This setup looks very similar to the March 13th high.
One other clue is if the QQQ starts underperforming the $SPX. If that happens, money will rotate away if the QQQ starts to underperform. This is shown in the purple area chart.
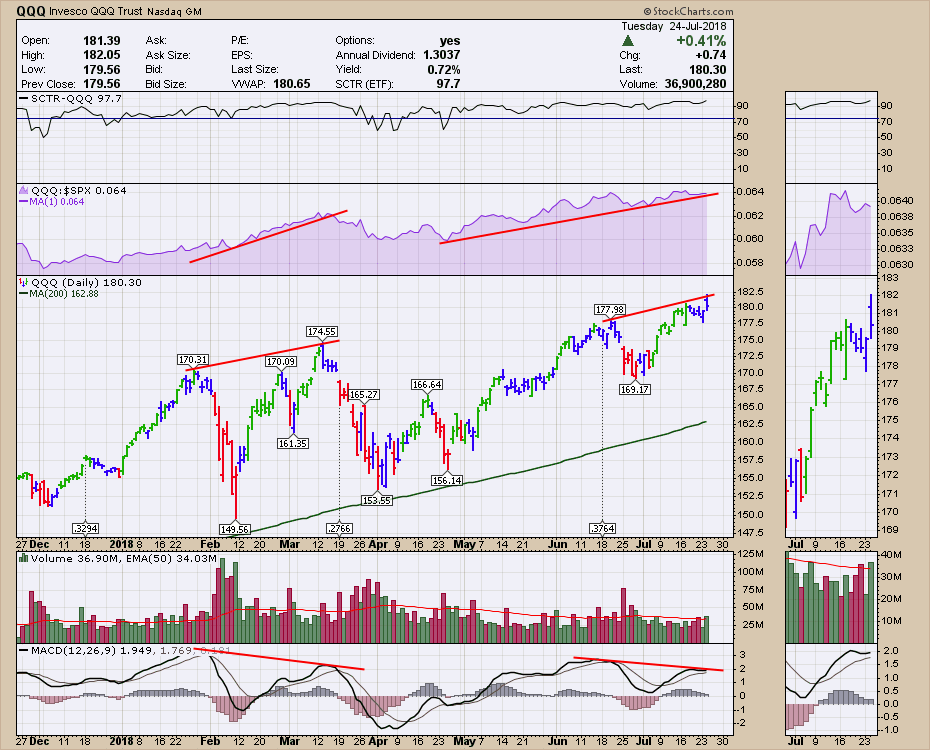
This can all still work out positively, but the risk level went up substantially after the market pulled back all day.
Below is the Commodities Countdown video that walks through the concerns in the index set up right now.
The Final Bar recording for Thursday July 19th contains information on the fresh Thursday breakout in the $USD. I cover off bonds as well. All of these markets are at very critical technical locations. If the USD is going to soar and create a bunch of trend changes on the other charts, you'll want to see the setups in advance. That is what the video covers off.
The Canadian Technician video discusses a lot of the sectors and specifically reviews the technology sector stocks.
If you are missing intermarket signals in the market, follow me on Twitter and check out my Vimeo Channel often. Bookmark it for easy access!
Good trading,
Greg Schnell, CMT, MFTA
Senior Technical Analyst, StockCharts.com
Author, Stock Charts for Dummies
Want to read more from Greg? Be sure to follow his two StockCharts blogs:
Commodities Countdown and The Canadian Technician
