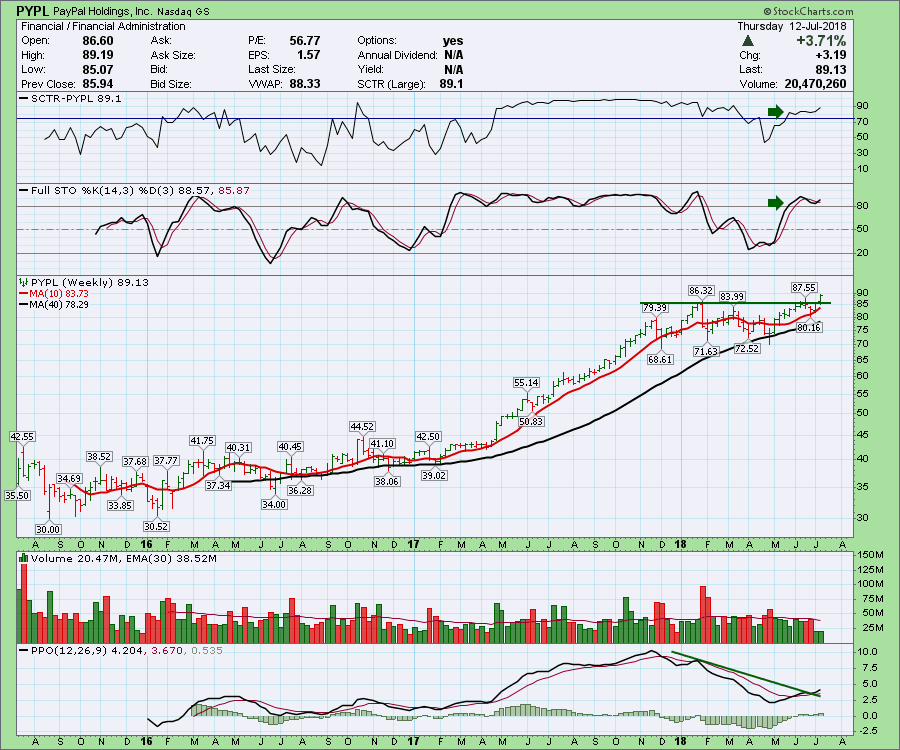
Paypal (PYPL) has been consolidating for 6 months. and this week it is breaking out fresh new highs along with Visa And Mastercard. These are very supportive consolidation patterns. Anyone who bought the stock in the last 6 months is now in a profit position and less likely to be a seller.
The SCTR shows Paypal outperforming 89% of the stocks. The full stochastic is holding above 80 which is very bullish. The PPO has pulled back and just broke the downtrend line. This is very bullish. Last weeks volume was anemic and this week's volume is very light after four days on a weekly volume bar. This light volume is concerning. If the breakout doesn't hold, $85 would be a good level to be stopped out at.
Here is the fresh new July 8th edition of the Commodity Countdown. I focused on the important resistance on the bond charts as well as the currencies. There are some important correlations between the $USD and the $SPX that need to be watched closely. The ugly Copper chart is discussed as well as the broader breakdown in Industrial Metals. This may be one of the areas hardest hit by the tariffs so we'll keep watching the charts there. Oil held above the 50 day moving average, but Natural Gas, Heating Oil, and Gasoline all fell below. I discussed Gold and Silver and added some very important notes to the Gold chart this week.
The Nasdaq and the Toronto Stock Exchange both tried to rally this week to resume their breakouts to new highs. There was some improvement in the precarious Bullish Percent indexes.
The Final Bar recording for Thursday July 5th contains information on the potential for rollover in the $USD. It also covers the recent surge in the advance/decline data. A view of Thursday's July 12th show will be available Friday.
For Canadian investors, here is a copy of the most recent Canadian Technician video. Canada suffered a failed breakout to end June. But if you are interested in Gold and Silver stocks I roll through 40 of them.
If you are missing clues on signals in the market, follow me on Twitter and check out my Vimeo Channel often. Bookmark it for easy access!
Good trading,
Greg Schnell, CMT, MFTA
Senior Technical Analyst, StockCharts.com
Author, Stock Charts for Dummies
Want to read more from Greg? Be sure to follow his two StockCharts blogs:
Commodities Countdown and The Canadian Technician
