With all the attention late last year on Disney with the ESPN subscription levels, the cast at Disney announced they were launching their own 'over the top' service. In July, Disney secured the buying of 21st Century Fox for $71 Billion. Needless to say, that investment is more than just a casual 'filling in some gaps' for Disney. At the completion of the deal, it is estimated Disney will own 40% of the box office. That's a wow. So with the Mouse House coming directly to your house, what do investors think?
Well, they like this a lot. Disney could break out to all time highs after earnings tonight. The stock is becoming one of the top performers with the SCTR moving above 75. The breakout to new 52 week highs is just the start. The momentum shown by the PPO has broken a three year downtrend.
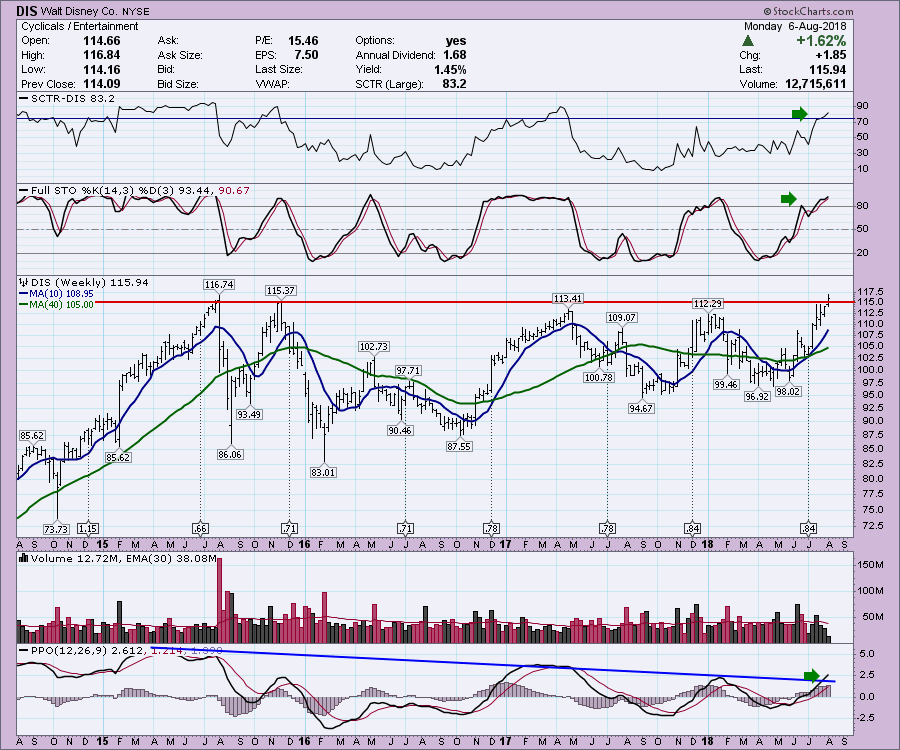
After the earnings release tonight, we have a solid opportunity to catch Disney on it's breakout after consolidating for three years. That should be something worth watching as long as the $115 level continues to hold.
Just a reminder, I am the opening speaker kicking off Chartcon 2018 on Friday morning, August 10th! DON'T BE LATE! I hope to be one of the strongest presentations to kick this off. While I love the SCTR, my presentation this year will be a totally different method of simply finding great set ups based on some of the biggest names in Technical Analysis. I am up against some fabulous speakers so I have my work cut out for me.
Seriously, when do you get to hear published authors Martin Pring, David Keller, Greg Morris, Alexander Elder, John Murphy, Arthur Hill, Tuchar Chande, Gatis Roze, and Greg as just part of the roster? People have crossed the world to listen to some of these presenters. I could list the full speaking roster here but its unbelievable! Follow this link to check out the entire list. Register right away so you get all of the information regarding how to optimize the software and the Chartcon guide.
Below is the Commodities Countdown video that walks through the commodities set up right now.
Below is the recording of The Final Bar show I mentioned above. As Apple moved above the trillion dollar market cap, the $INDU chart closed down on the day. This led into a discussion about examining the underlying price action and how to quickly create index chartlists with just a few keystrokes.
Below is the recording of The Canadian Technician Video. This video shows some great examples of how breadth breaks down before the markets weaken.
Don't forget to register for Chartcon 2018.
If you are missing intermarket signals in the market, follow me on Twitter and check out my Vimeo Channel often. Bookmark it for easy access!
Good trading,
Greg Schnell, CMT, MFTA
Senior Technical Analyst, StockCharts.com
Author, Stock Charts for Dummies
Want to read more from Greg? Be sure to follow his two StockCharts blogs:
Commodities Countdown and The Canadian Technician
