Cerner (CERN) remains in a long-term downtrend, but the stock broke a resistance level and pulled back to this breakout zone, which now turns into support. This is called a throwback and it could offer a second chance to partake in the breakout.
First and foremost, CERN is in the early stages of a long-term trend reversal, at best. The long-term trend is still down because the 50-day EMA remains below the 200-day EMA (PPO is negative). However, the stock did exceed the May-July highs and the 200-day SMA.
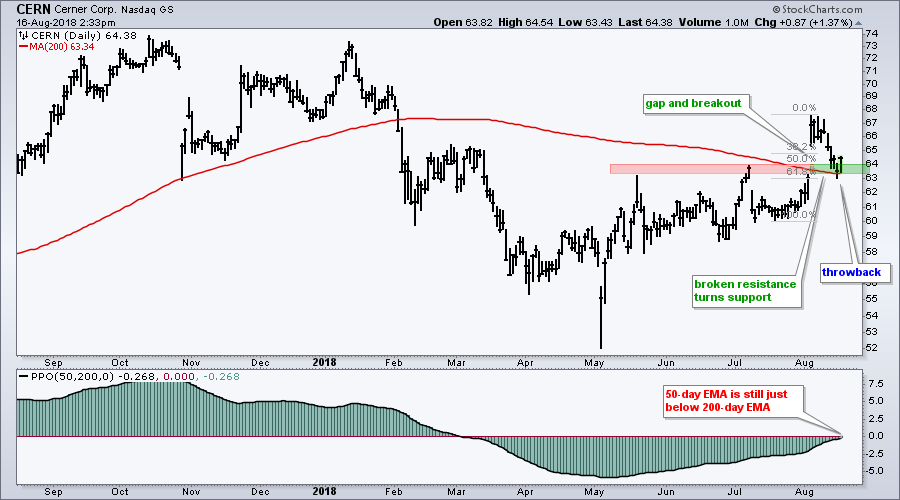
The breakout zone and the 200-day SMA could offer support on this throwback. Also note that this is a gap zone and the 61.8% retracement are in play. Thus, the chart shows the makings of a short-term reversal zone as the stock bounces today, throwback Thursday.
Plan Your Trade and Trade Your Plan.
- Arthur Hill, CMT
Senior Technical Analyst, StockCharts.com
Book: Define the Trend and Trade the Trend
Twitter: Follow @ArthurHill
