 When markets are in transition and the bigger picture needs our attention it is always good to keep an eye on the yield curve.
The absolute yield levels of the various maturities on the curve, starting at 3-Months all the way out to 20+ years are important to monitor. But what's probably even more important to monitor is the change of the shape of the curve.
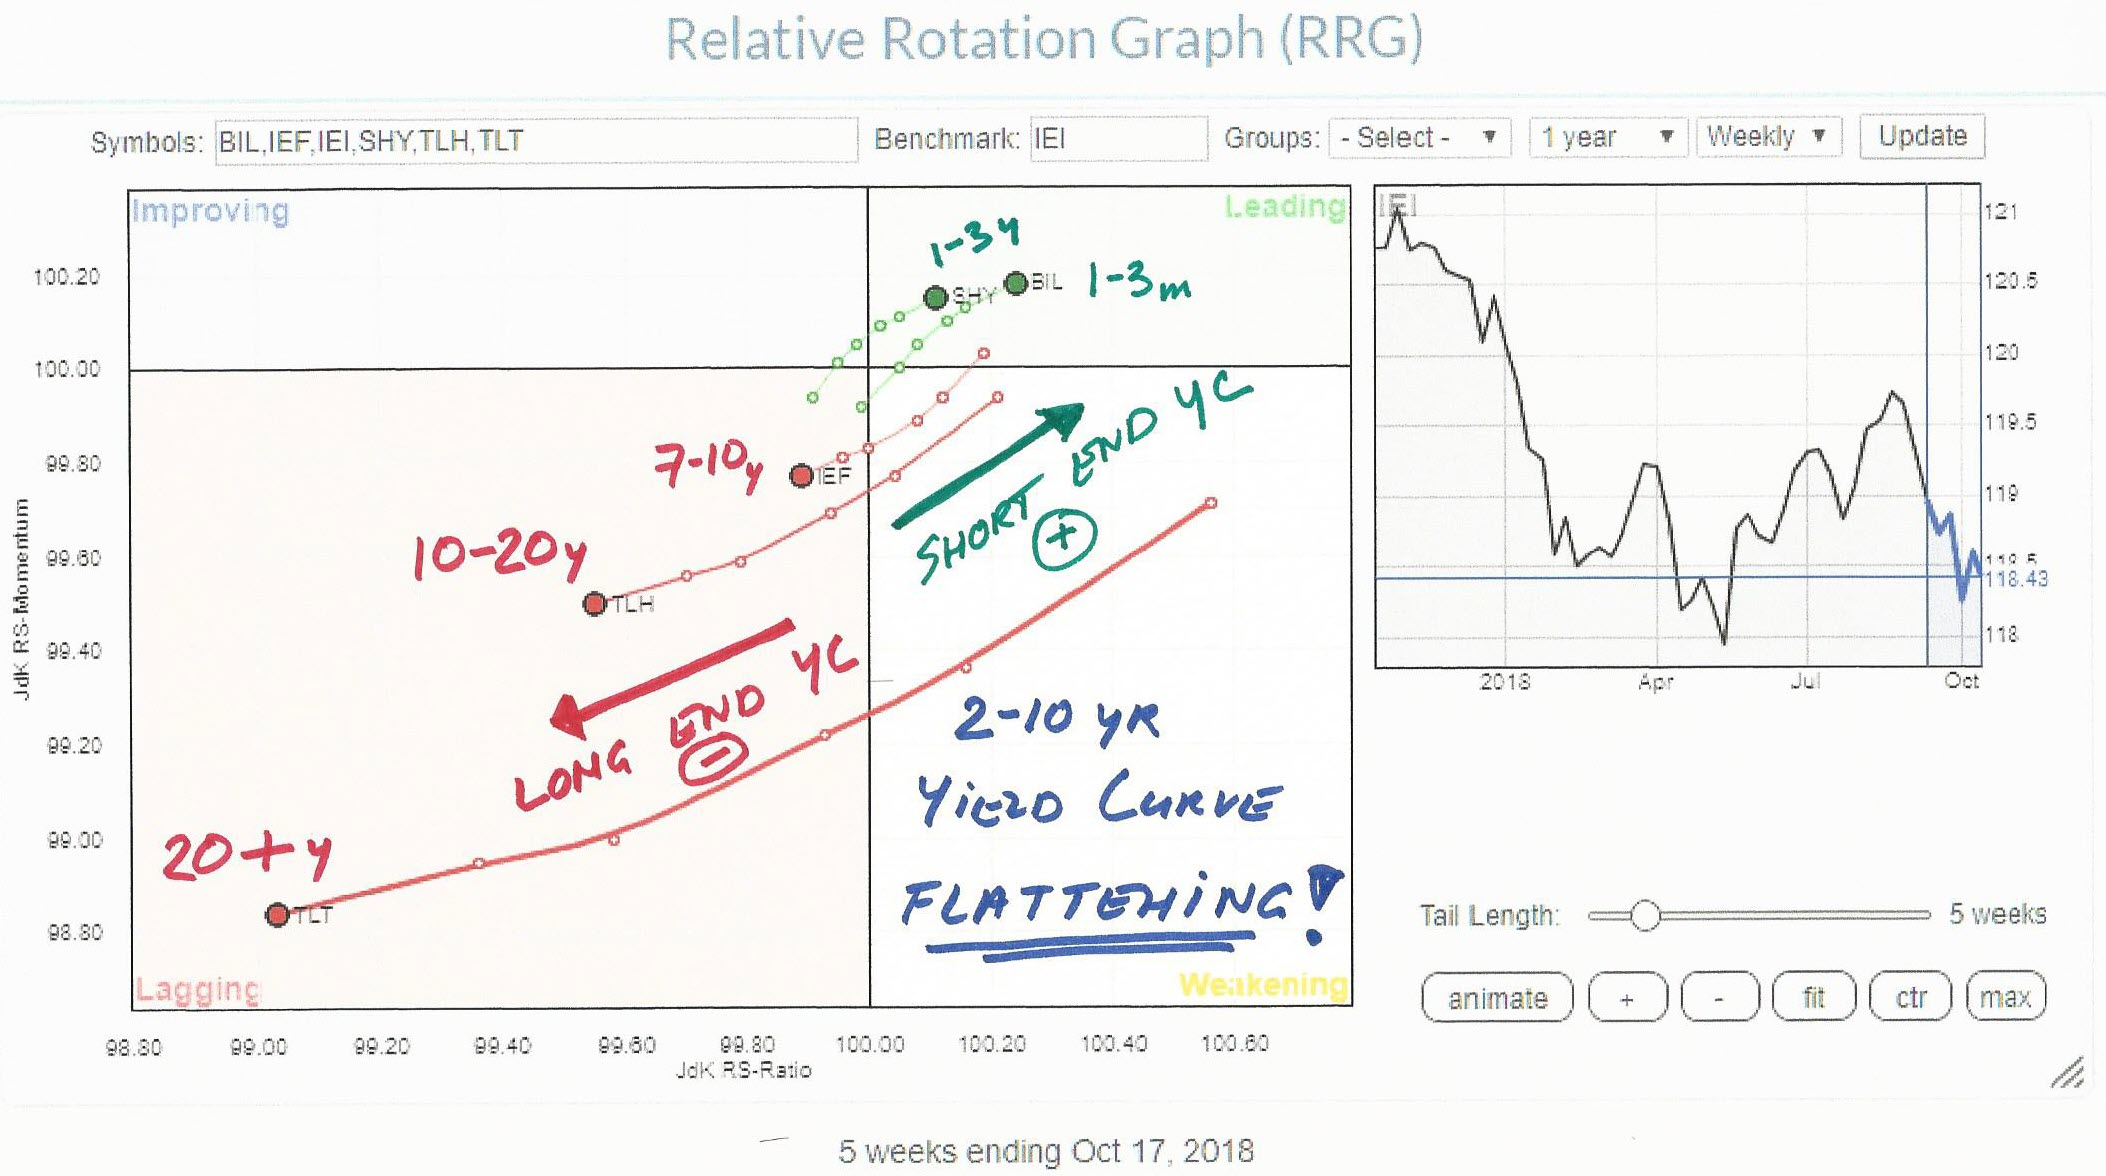
Relative Rotation Graphs can be of help analyzing the shape and the change in shape of the curve. The picture above shows the rotation of the various maturities around the 3-7 year maturity which is the benchmark (center) for this group.
You're looking at ETFs (as a proxy for bonds) so rising prices means falling yields and vice versa.
We know that overall yields are on the rise for a while already, i.e. the accompanying ETFs are declining. What this RRG above shows is that the shorter maturities are falling not as fast as the longer maturities. Or short-term yields rise faster than long-term yields.
This means a "flattening" curve which is characteristic that belongs to an economy that is in a full recovery or (moving into) an early recession.
With the direction of the various maturities on the RRG so pronounced the question arises whether the bond markets are sending us a message?
My regular blog is the RRG blog If you would like to receive a notification when a new article is published there, simply "Subscribe" with your email address using the form below.
Julius de Kempenaer | RRG Research
RRG, Relative Rotation Graphs, JdK RS-Ratio, and JdK RS-Momentum are registered TradeMarks ®; of RRG Research
Follow RRG Research on social media:
Feedback, comments or questions are welcome at Juliusdk@stockcharts.com. I cannot promise to respond to each and every message but I will certainly read them and where reasonably possible use the feedback and comments or answer questions.
If you want to discuss RRG with me on SCAN, please use my handle Julius_RRG so that I will get a notification.
