 The recent rally of the S&P 500 index off the lows near 2600-2625 is nice but is it sustainable?
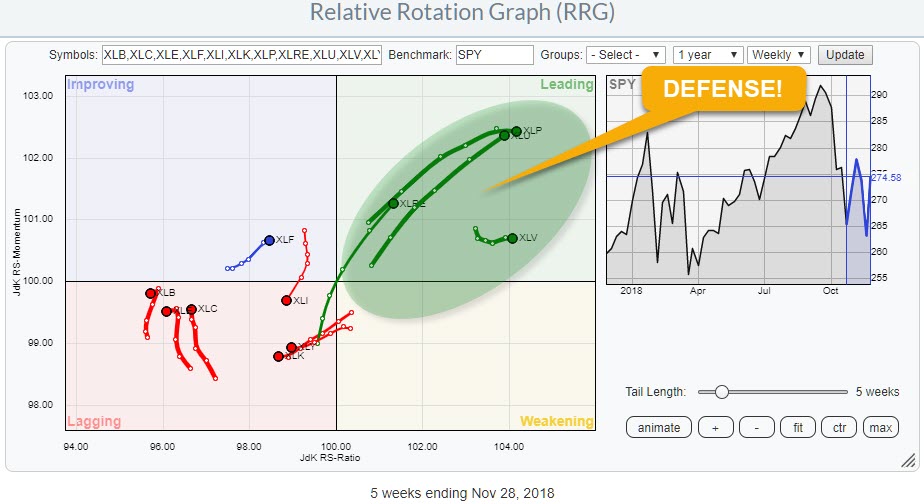
The Relative Rotation Graph above shows the rotation of the 11 SPDR sector ETFs against SPY and the message is very clear!
There is a clear split between the sectors. Four sectors are inside the leading quadrant and they are all still heading higher on the Jdk RS-Ratio scale, i.e. gaining relative strength versus the S&P 500.
There are six sectors inside the lagging quadrant and only one (XLF) is in the improving quadrant.
If we look at the tails and the curves of the rotation we see especially long tails on three out of the four sectors inside the leading quadrant. This means strong moves that are likely to continue for Staples, Utilities and Real Estate. Healthcare shows a shorter tail but that sector recently went through a small correction which only flattened the rotation a bit.
This means that the leading quadrant is entirely populated by defensive sectors.
The opposite goes for the leading quadrant. Here we find all sectors that can be characterized as offensive. Technology and Discretionary moved over from weakening a few weeks ago and both are still heading lower on the RS-Ratio scale.
Industrials rolled over into lagging again from improving, maintaining its weak relative strength.
XLB,XLC and XLE are way to the left in negative territory and seem to be turning to the right again without even reaching the improving quadrant.
All in all this Relative Rotation Graph is, still, sending a RISK OFF message.
My regular blog is the RRG blog If you would like to receive a notification when a new article is published there, simply "Subscribe" with your email address using the form below.
Julius de Kempenaer | RRG Research
RRG, Relative Rotation Graphs, JdK RS-Ratio, and JdK RS-Momentum are registered TradeMarks ®; of RRG Research
Follow RRG Research on social media:
Feedback, comments or questions are welcome at Juliusdk@stockcharts.com. I cannot promise to respond to each and every message but I will certainly read them and where reasonably possible use the feedback and comments or answer questions.
If you want to discuss RRG with me on SCAN, please use my handle Julius_RRG so that I will get a notification.
