Through this wide ranging volatile period, it has been harder to find great trades. When the market pulls back, the skittishness of the investing community soars. I have had two different stocks in nice set ups plunge with 20% drops in a day. The earnings reports are literally implosion documents if they miss the consensus view. Apple is a case in point. Small position size helps.
At the same time some stocks have been smooth and steady. I like the look of CME, but today I want to highlight ICE as it is just starting to break out. Starting at the top, the SCTR has surged to new 52 week highs and it has just recently moved into the top 25%. The relative strength chart in the shaded area chart shows ICE performing in line with the $SPX until recently. All of the sudden, the stock has soared in relative performance. While the full Stochastic has returned to the top of the range, the big picture on the full stochastic shows a stock that never sees a full stochastic reading below 20! The big positive volume bar a few weeks ago shows a large interest by buyers even while the overall markets were weak.
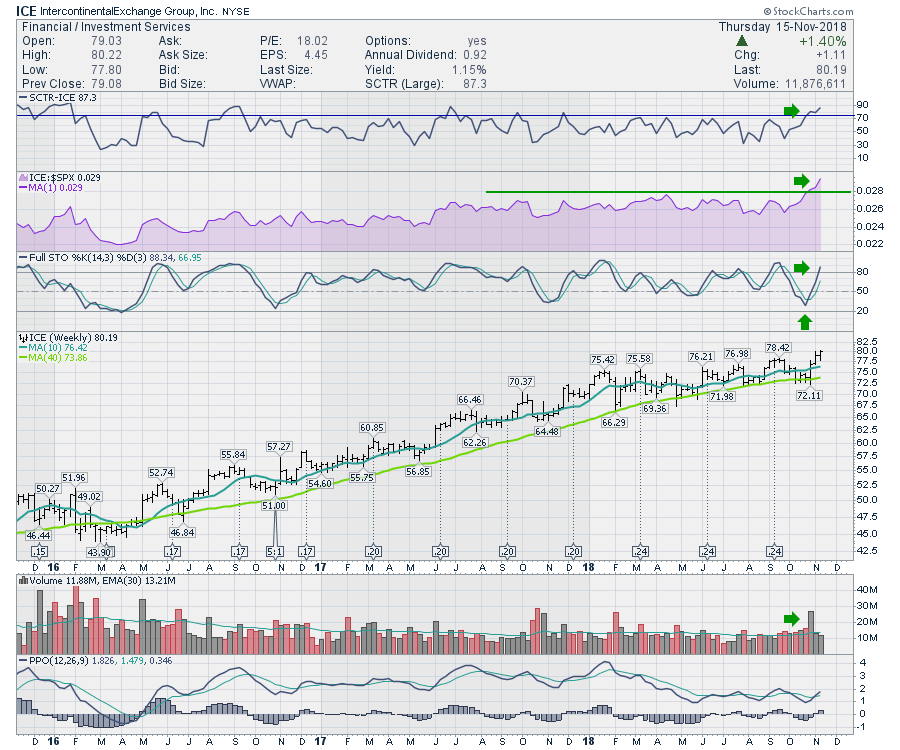 This is a nice strong stock that is just breaking out to new 52-week highs. The market is still working to break out of the hole, so keep stops in place.
This video covers off some of the recent price action including Gold and a return to some of the growth sectors.
Here is this week's broad market review video.
If you are looking for a small gift, you might have family or friends that would like to learn more about the basics of charting. The first section of the book walks through all the chart settings to get the charts you want. The second section is why you might use charts for investing and the third section is putting it all together.
Click here to buy your copy today! Stock Charts For Dummies.
The Canadian Technician video shows the bounce off the late October lows in Canada. Canada is back below the 2008 highs. Tough ten years for investors.
If you are missing intermarket signals in the market, follow me on Twitter and check out my Vimeo Channel often. Bookmark it for easy access!
Good trading,
Greg Schnell, CMT, MFTA
Senior Technical Analyst, StockCharts.com
Author, Stock Charts for Dummies
Hey, have you followed me on Twitter? Click the bird in the box below!
Want to read more from Greg? Be sure to follow his StockCharts blog:
The Canadian Technician
