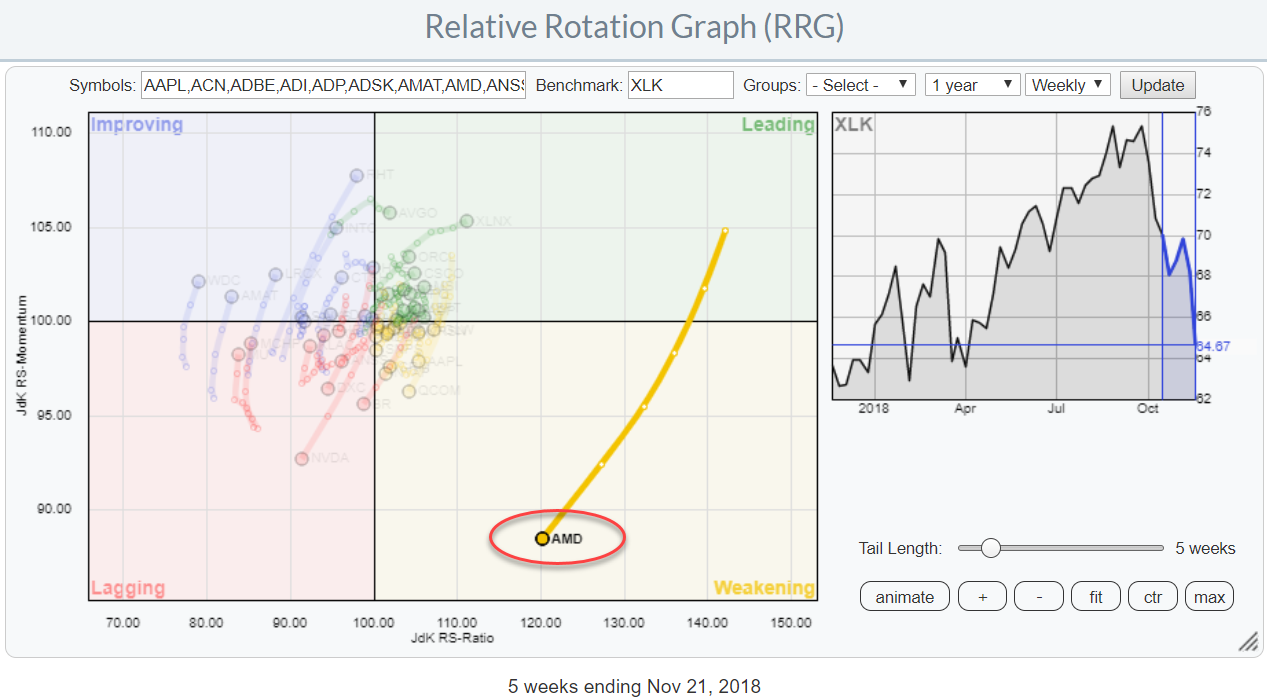
 The Relative Rotation Graph for the technology stocks in XLK (Technology select sector SPDR) shows one big outlier that recently went through a big rotation. It crossed from improving to leading in June then pushed to a JdK RS-Ratio value over 140 before rolling over. Three weeks ago the rotation went from the leading quadrant into weakening and is now showing the longest tail in this universe.
After a high at $34 in the week of 14 September, the stock dropped to a low at $16 in the week ending 2 November. A loss of more than 50%...
The victim's name? : AMD (Advanced Micro Devices Inc.)
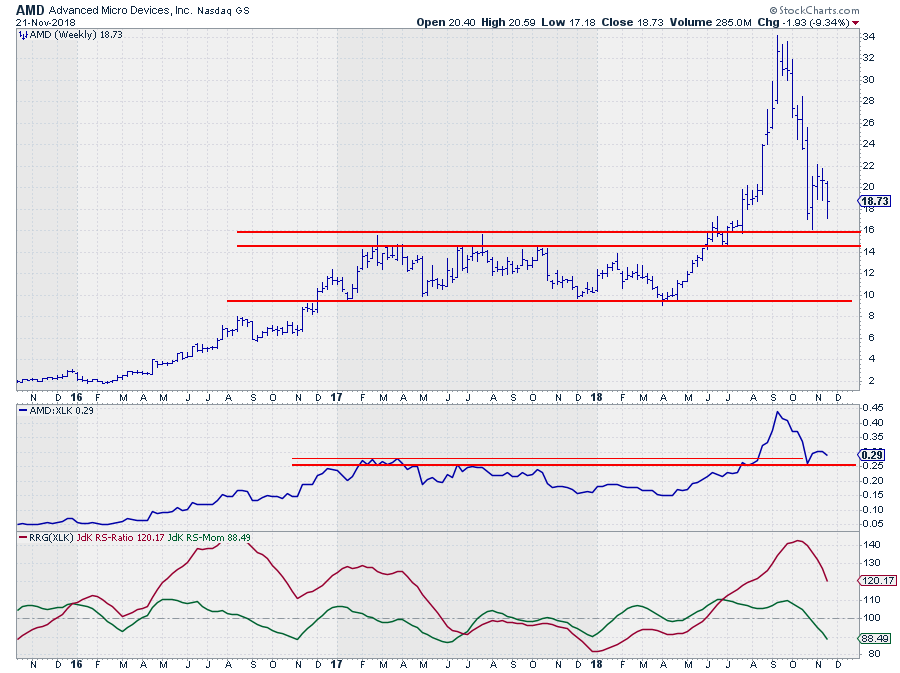 This is one nasty chart. I suspect most readers will agree with me.
And in hindsight, it was or would have been very difficult to get out in time, on the weekly time-frame at least.
There were some warning signals on a daily chart. Like a small triangle- or double-top (-ish) pattern in September. But if you, like me, concentrate on the weekly time frame it would have been hard to capture these signs.
But... From a relative perspective, AMD is still ahead of XLK since the April low in the RS-line where the advance began.
On the weekly chart, both price and relative bounced at an important horizontal support level which makes AMD a stock that is, at least, interesting to watch. It is probably too early to buy right away but we are getting into an area (price and relative) that makes AMD much more attractive from a buyers perspective than a few months ago.
The position on the RRG, inside weakening and with a long tail but at a very high RS-Ratio reading, makes it very well possible that AMD will rotate back up towards leading again without hitting the lagging quadrant in coming weeks.
On the daily RRG AMD is inside the improving quadrant but already rolling over towards lagging again, suggesting that not all (relative) downside has been consumed yet.
What will I be looking for in the coming weeks?
- on the daily RRG, a rotation from improving back to lagging and then to improving and leading.
This will put the stock back on track for short-term outperformance - on the weekly RRG, assuming the rotation on the daily RRG will take place, a slow-down of the rotation visible by a shortening tail, followed by a rotation back up towards the leading quadrant
This will then bring the weekly and daily time frames in line - on the daily and weekly price charts, the support area between $14-16 should hold (preferably $16 should not be broken)
- a break above the fresh resistance level at $22 will be a good trigger but more aggressive buying opportunities may arise at or near the support level, maybe a Turtle Soup setup?
My regular blog is the RRG blog If you would like to receive a notification when a new article is published there, simply "Subscribe" with your email address using the form below.
Julius de Kempenaer | RRG Research
RRG, Relative Rotation Graphs, JdK RS-Ratio, and JdK RS-Momentum are registered TradeMarks ®; of RRG Research
Follow RRG Research on social media:
Feedback, comments or questions are welcome at Juliusdk@stockcharts.com. I cannot promise to respond to each and every message but I will certainly read them and where reasonably possible use the feedback and comments or answer questions.
If you want to discuss RRG with me on SCAN, please use my handle Julius_RRG so that I will get a notification.
