There are a lot of bases forming currently inside the great wall of China. After suffering a huge downtrend, these charts are setting up for new buy signals each and every day. I'll be on StockCharts TV's MarketWatchers Live show (Monday, January 28th at noon ET) to talk about some of these setups, which have been particularly compelling given the recent pullbacks. Some have even started to move out of their bases with 10% moves each week!
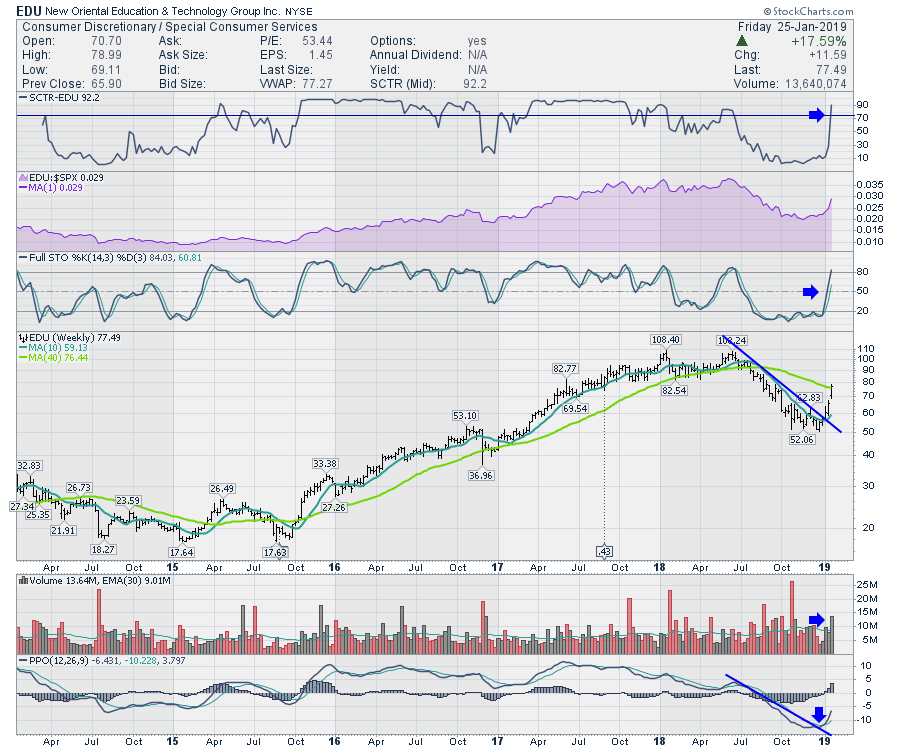
I want to give you an example of the kind of things that are starting to appear on these setups. Here is EDU, with an absolutely beautiful breakout! For two weeks in a row, the stock has been soaring. The SCTR ranking is moving back above 75, which suggests a strong stock with some of the best price action out there. The relative strength is moving to new four-month highs. Also noteworthy is the fact that the stock price closed above the 40-week moving average for the first time since July. The volume suggests we are not the only ones interested here, with a 50% higher-than-average volume! I like the break in the six-month downtrend on the PPO indicator, which shows us that the momentum has clearly turned to the upside. While it is hard to buy a stock up 30% in a few weeks, there are dozens setting up bases like this.
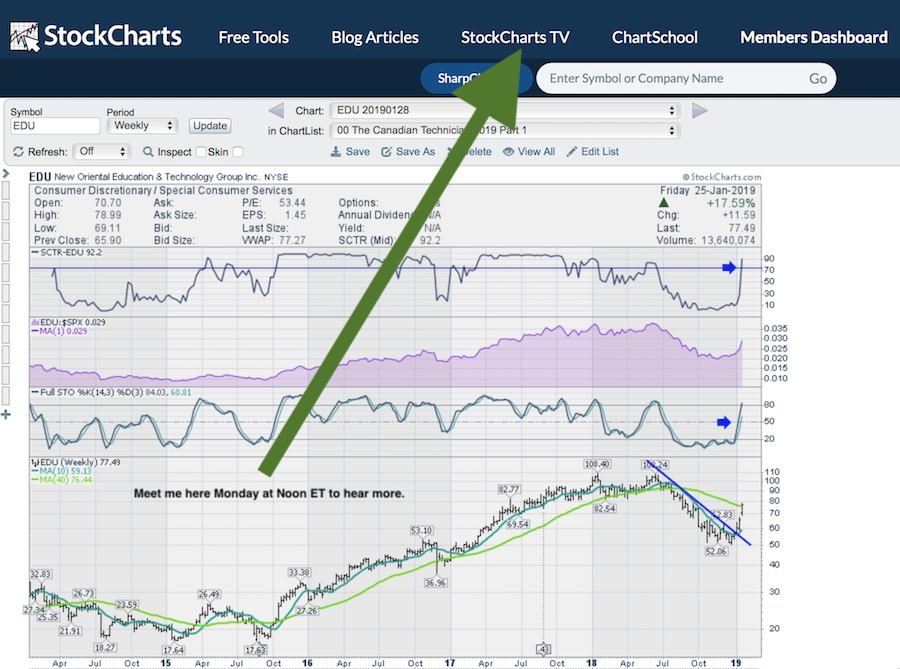
 As mentioned, I'll be on MarketWatchers Live at noon ET on Monday. You can find the show under the StockCharts TV tab on the StockCharts.com webpage. (You can also click on the image below to go directly there.)
A lot of charts continue making bullish turns. If you are looking for some positive areas of the market to investigate, I would strongly encourage you to view the Weekend Market Roundup video, which you can also find in the "Canadian Technician" articles. Follow this link to "The Canadian Technician" and don't forget to subscribe.
I had two shows this week for Market Buzz on StockCharts TV, where there have been some beautiful sector setups to talk about recently. This new show is dedicated to weekly timeframe investing. Please follow me on Twitter and subscribe to my blog for regular updates.
There are some Canadian charts that look outstanding! This is my Canadian Market Review.
If you would like to learn more about the basics of charting, check out Stock Charts for Dummies. The first section of the book walks through all the chart settings to get the charts you want, the second section explores why you might use charts for investing and the third section is about putting it all together.
Click here to buy your copy of Stock Charts For Dummies today!
If you are missing intermarket signals in the market, follow me on Twitter and check out my Vimeo Channel. Bookmark it for easy access!
Good trading,
Greg Schnell, CMT, MFTA
Senior Technical Analyst, StockCharts.com
Author, Stock Charts for Dummies
Hey, have you followed Greg on Twitter? Click the bird in the box below!
Want to read more from Greg? Be sure to follow his StockCharts blog:
The Canadian Technician
