There is a specific culture on this continent that walks and talks the Star Wars franchise. This year, Disney has the Millennium Falcon ready to launch in both of their American theme parks. Disney (DIS) is widely held across the investing spectrum, from people picking the first piece of their portfolio to the most experienced institutions in the financial sector. Now, after consolidating for years, the chart is at a major inflection point.
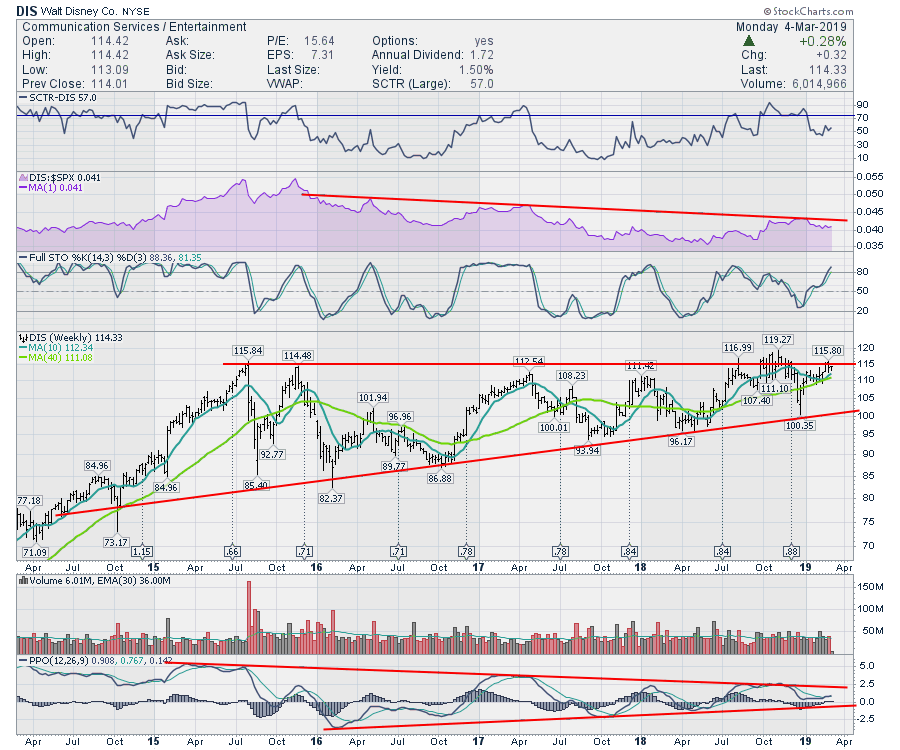
Disney's SCTR suggests the stock is just average, with a ranking just above 50. The SCTR is like a sports ranking for stocks, comparing which ones are moving price up faster than other stocks. The DIS chart is drifting lower in relative strength, shown in purple. What this indicator implies is that the stock is marginally underperforming the SPX over the last few years.
However, the price couldn't be at a more interesting level. This four-year ceiling is being tested as Disney gets America set up for a flood of Star Wars enthusiasm. The rising lows with a flat top is considered an ascending triangle pattern. When this pattern successfully breaks out, the measured move would be $155 as a target. The PPO panel shows momentum, which usually turns higher before price. Additionally, we can see a similar pattern in momentum as in price. However, the momentum shows a declining line across the peaks, suggesting that every subsequent rally is getting weaker. An important change in trend would occur as all four of these indicators start to accelerate higher together. As Disney prepares to launch the Millennium Falcon, it is decision time for the investment community.
 I think it is an important time for Disney, so Don't Ignore This Chart!
Below is some information on other videos produced this week.
Now that the market has rallied, it will be more important than ever to focus on winning areas or industry groups. Using the tools on StockCharts can help you stay on top of the strongest areas of the market. In my Friday Market Buzz, I showed how to scan for any stocks that made new highs at some point in February. You can click on the image below to watch the video, where you may find some stocks suited to your portfolio.
If you would like to learn more about the basics of charting, check out Stock Charts for Dummies. The first section of the book walks through all the chart settings you need to help you get the charts you want, the second section explores why you might use charts for investing and the third section is about putting it all together.
Click here to buy your copy of Stock Charts For Dummies today!
If you are missing intermarket signals in the market, follow me on Twitter and check out my Vimeo Channel. Bookmark it for easy access!
Good trading,
Greg Schnell, CMT, MFTA
Senior Technical Analyst, StockCharts.com
Author, Stock Charts for Dummies
Hey, have you followed Greg on Twitter? Click the bird in the box below!
Want to read more from Greg? Be sure to follow his StockCharts blog:
The Canadian Technician
