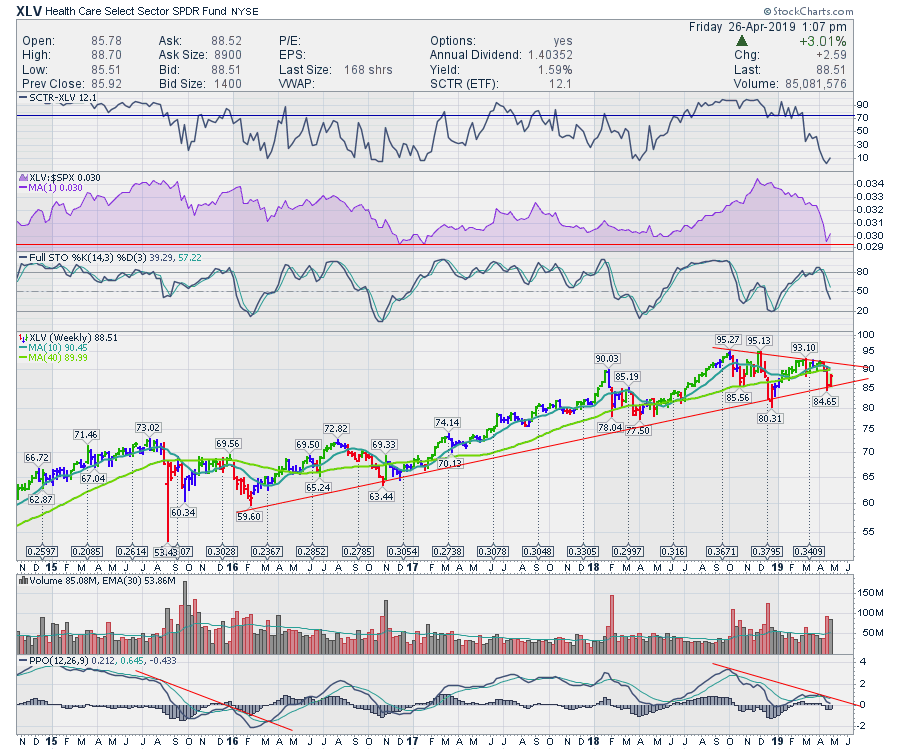
The Healthcare sector recently broke to 2019 lows. Does that make the sector a don't-touch, even as the market makes all-time highs? Well, this week's price bar looks like a strong bounce off a three-year support line. With that as a backdrop, the chart provides some more information that suggests this is a tradable low, with support nearby to shoot against.
The Pros:
- Healthcare's SCTR ranking is at its lowest point in 5 years. It does not usually stay down at this level, but it will have to start outperforming to climb back up past how other ETFs are performing. Because Healthcare does not stay low for long, there may be a nice opportunity to get some lift off the lows.
- Buying near 5-year $SPX relative strength lows in purple should attract value investors, which is great for a defensive sector.
- Buying near long-term support. The healthcare sector is a defensive sector and typically underperforms when the growth sectors are leading the market. If the overall market stalls, we would look for defensive groups like staples and healthcare to be rotated into. An attractive entry while the group is out of favor also results in higher-dividend yields.
- Volume coming into the low was extreme, buying volume is big this week, which suggests lots of interest at this level.
- PPO is declining, but it is still above zero and starting to turn from down to flat. The stalling of momentum to the downside is the first phase of the bottoming process. A turn up here off the zero line is a very bullish place to expect a bounce, and this looks to be setting the stage. The trend line is also not far away, so a quick turn could really improve the breakout.
- SCTR suggests it is one of the worst-performing ETFs out there currently. Even if this improves, it is still not in the top group.
- The very weak relative strength compared to the $SPX is difficult to buy. Value buyers step in on extreme lows, but momentum investors will be keen to reduce positions. Buying underperforming assets is not usually a good investing trait for outperforming (other than swing trades).
- The full stochastic is still in steep decline. This momentum suggests a difficult entry at this point.
- The declining tops on the chart are problematic. The trend is down with lower highs and lower lows this year.
- The PPO momentum indicator is still pointing down and, until it turns up, no signal will be created.
After looking at the chart, this looks to be a good entry only on the basis of a tight stop. Most other parameters suggest another week would help the base build for a more conservative entry. Aggressive traders may choose to enter here, but don't let it get away. A tight stop should work well if the chart is continuing to bounce off the lows.
Good trading,
Greg Schnell, CMT, MFTA
Senior Technical Analyst, StockCharts.com
Author, Stock Charts For Dummies
Want to stay on top of the market's latest intermarket signals?
– Follow @SchnellInvestor on Twitter
– Connect with Greg on LinkedIn
– Subscribe to The Canadian Technician

