Don't Ignore This Chart! May 31, 2019 at 03:47 PM
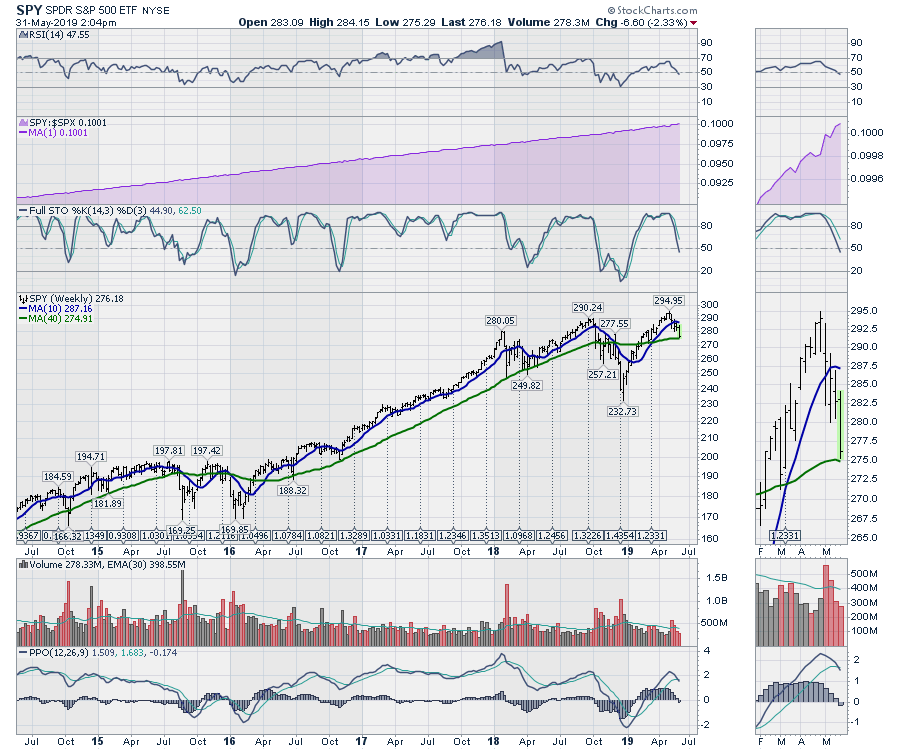
The SPY is a tracking ETF for the S&P 500. What that means is that SPY represents the price action of the $SPX; in fact, it actually outperforms the $SPX, as investors holding the SPY also get the dividends... Read More
Don't Ignore This Chart! May 30, 2019 at 06:53 AM

It seems I did not have to look very far to find today's DITC entry... The S&P 500 ($SPX) provides enough ammunition to get excited - or maybe worried is a better word - and not ignore the price action that is unfolding at the moment... Read More
Don't Ignore This Chart! May 29, 2019 at 07:21 AM

Cardiovascular Systems (CSII) shows bullish price action with signs of accumulation that could lead to higher prices. First and foremost, the long-term trend is up because CSII recorded a new high in early March and is above the 200-day SMA... Read More
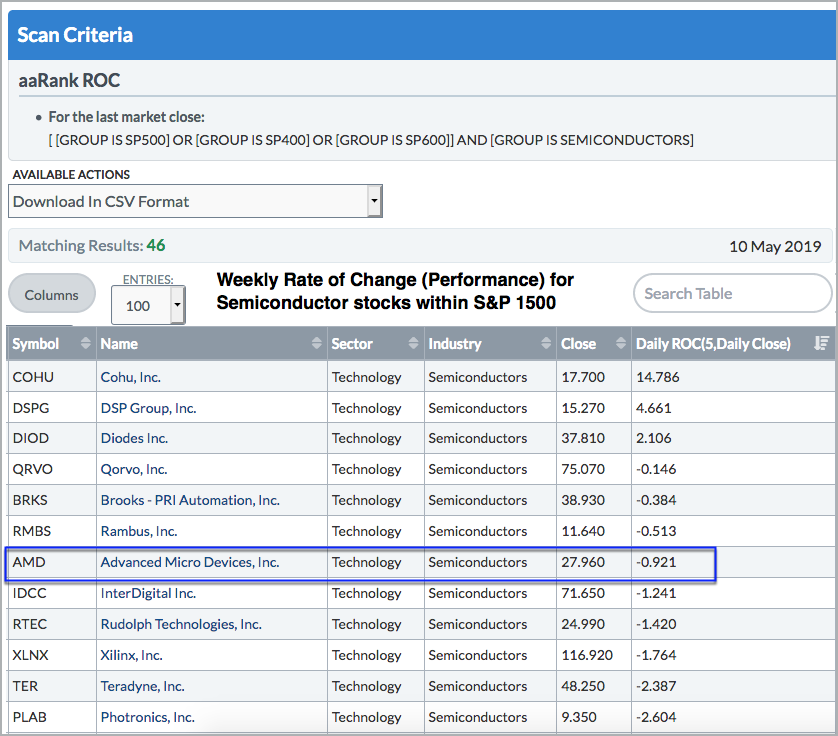
Don't Ignore This Chart! May 28, 2019 at 01:07 PM
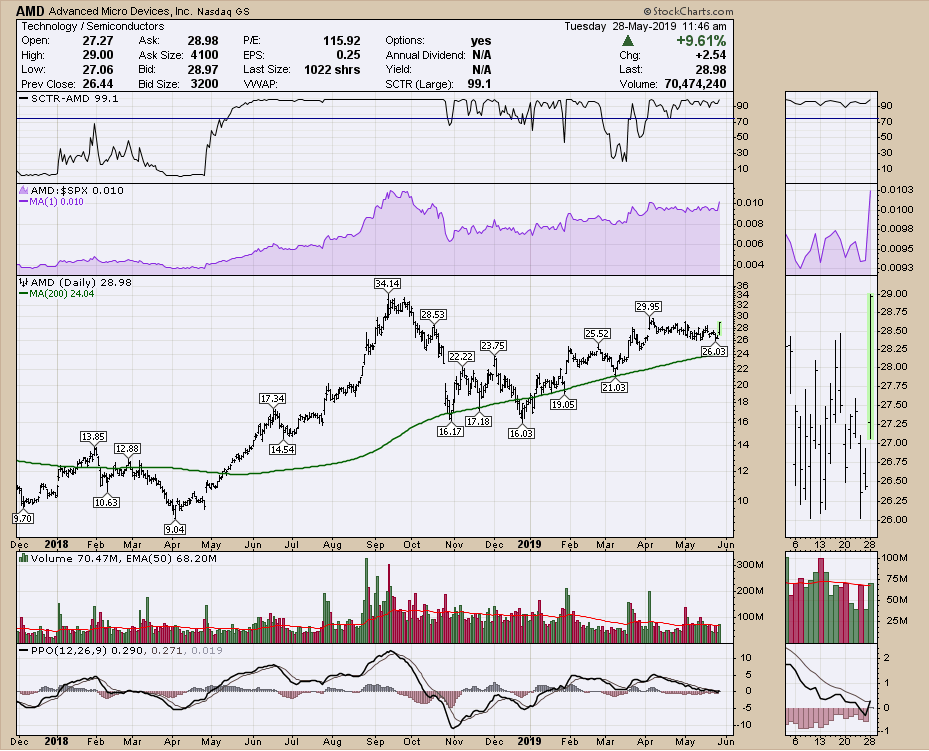
Semis have been getting short-circuited lately. The $SOX chart looks abysmal. However, the chart of AMD continues to hold up in the face of industry weakness. When a stock refuses to be beaten down with the rest of the group, this is indicative of clear investor interest... Read More
Don't Ignore This Chart! May 24, 2019 at 12:30 PM
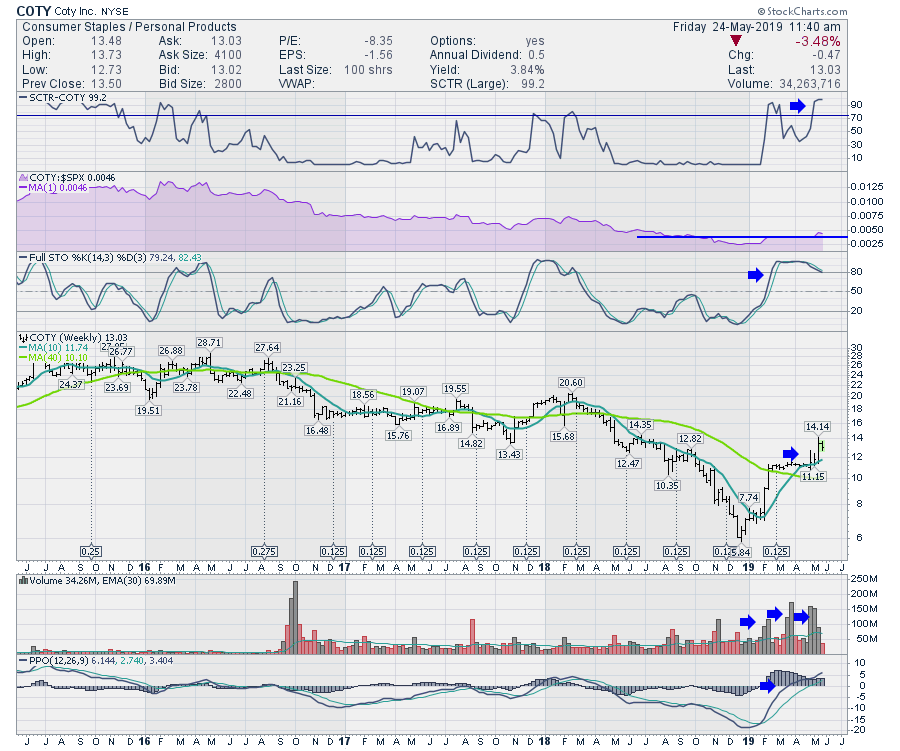
The four-year chart for Coty (COTY), a consumer staples fashion house, has not been one of beauty; rather, it looks like ten miles of bad road, as dad used to say. This month, though, something happened that changed the trend and put lipstick on my interest in the stock... Read More
Don't Ignore This Chart! May 23, 2019 at 05:29 AM
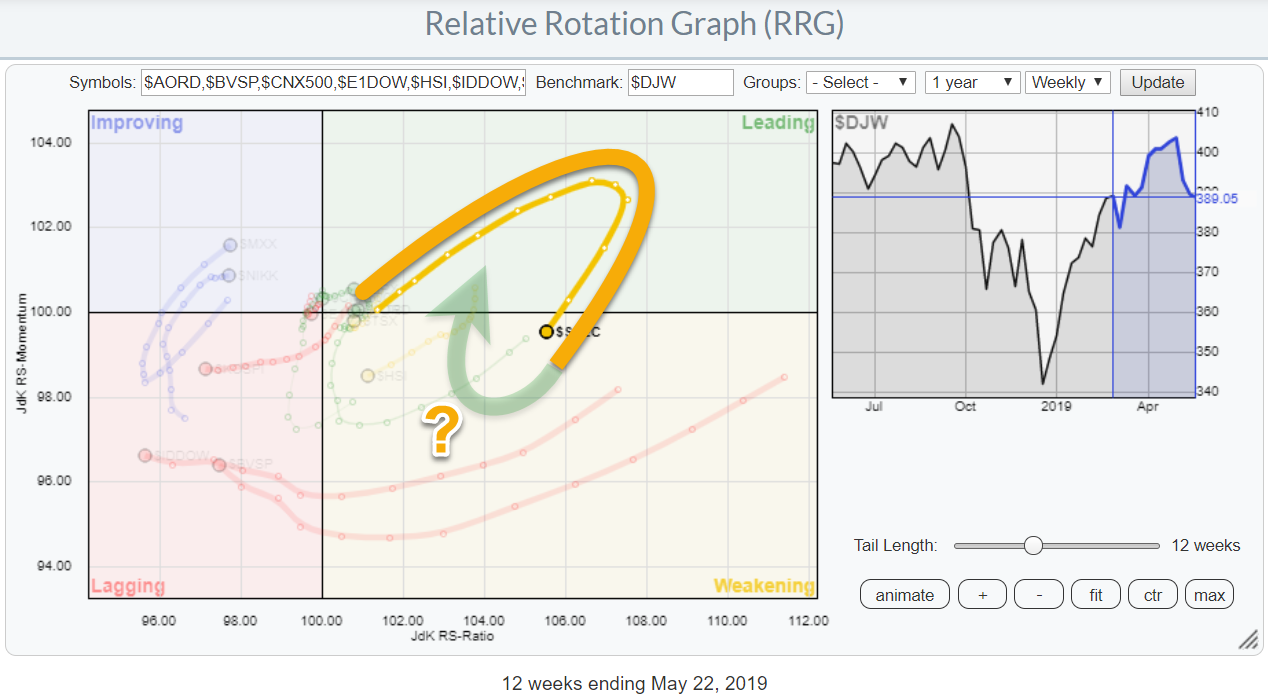
Yesterday, I wrote about the relationship of US stocks against other international stock markets in my regular RRG Charts article. The Relative Rotation Graph that I use for these analyses is one of the pre-defined groups and is shown above... Read More
Don't Ignore This Chart! May 22, 2019 at 06:45 AM

An existing uptrend and short-term breakout on high volume point to higher prices for Boston Scientific. The chart below show BSX hitting a new high in early March and then falling rather sharply into mid April... Read More
Don't Ignore This Chart! May 21, 2019 at 10:30 PM
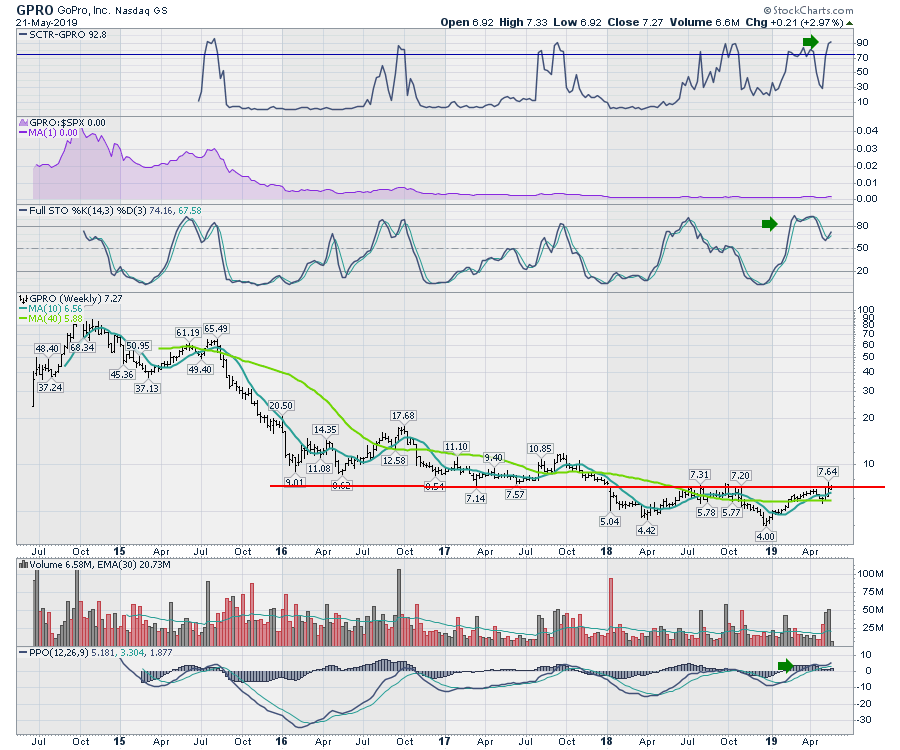
GoPro (GPRO) is a classic IPO that initially traded with a lot of hype before ultimately losing its mojo. The stock IPO'd almost 5 years ago and has been in a big slide ever since... Read More
Don't Ignore This Chart! May 20, 2019 at 11:10 AM

Ross Stores (ROST) recently bounced off its rising 200-day SMA with a bullish candlestick pattern and short-term RSI broke to its highest level of the month. It looks like the short-term pullback is ending and the bigger uptrend is resuming... Read More
Don't Ignore This Chart! May 17, 2019 at 03:42 PM
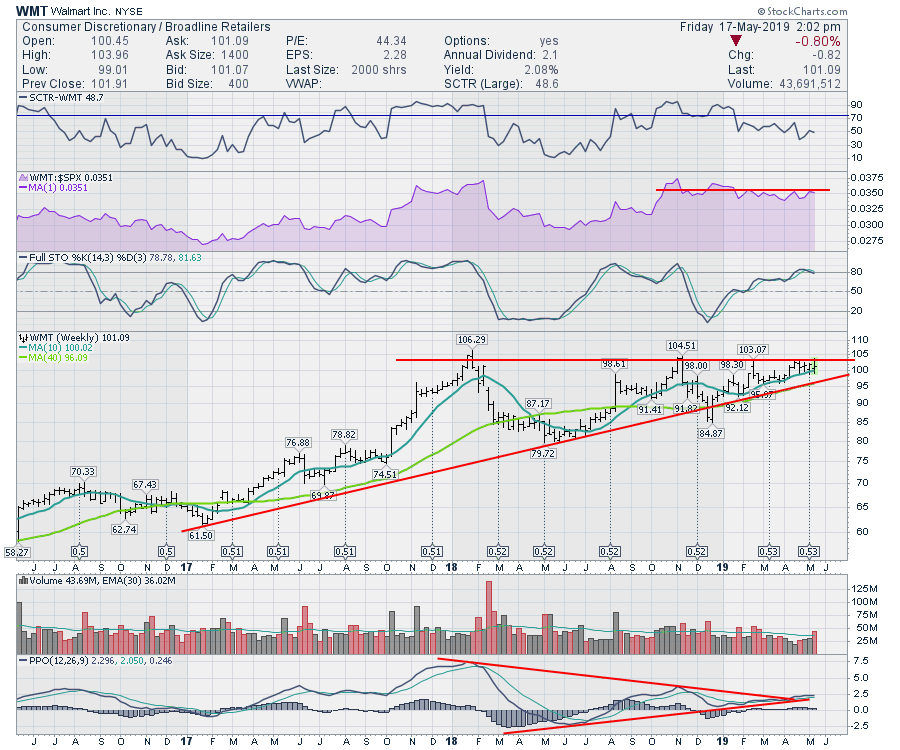
A few years ago, Walmart bought Jet.com, an online retailer. It was a big purchase of an unprofitable retailer, but the expertise of the online platform management was part of the action... Read More
Don't Ignore This Chart! May 16, 2019 at 01:38 PM
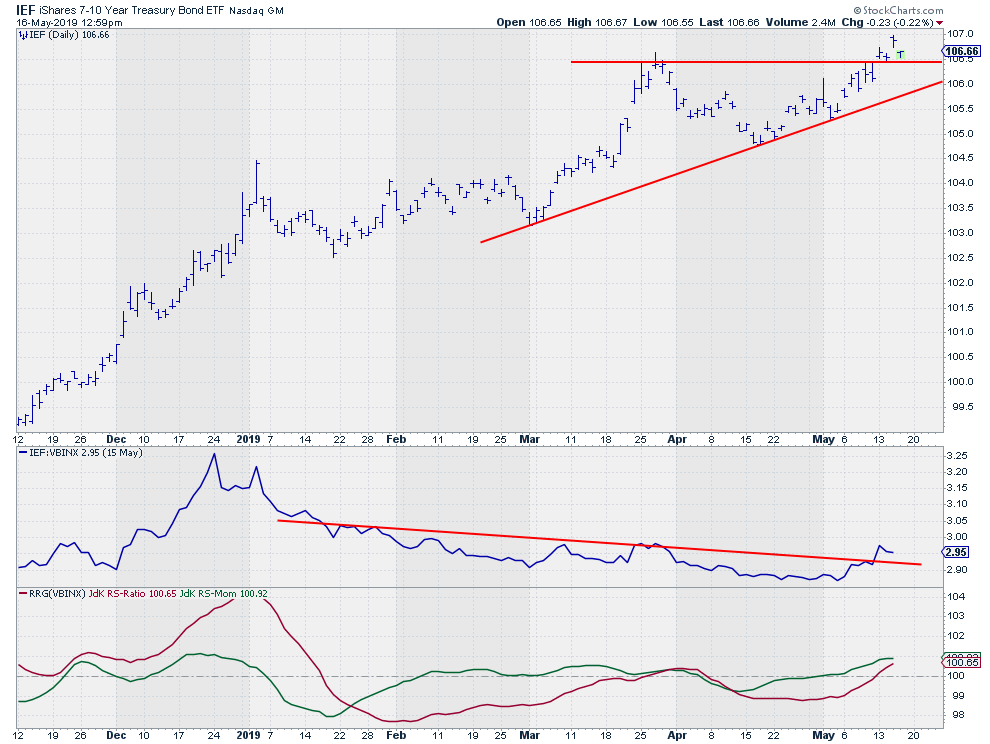
Browsing some Relative Rotation Graphs, the relationship between Stocks and Bonds once again drew my attention. When I shifted to their respective charts, I decided that the current price action of IEF, as shown in the graph above, deserves our (or, at least, my) attention... Read More
Don't Ignore This Chart! May 15, 2019 at 06:45 AM

General Electric (GE) is one of the worst performing stocks over the last two years, but the stock is perking up in 2019 and outperforming in May. The S&P 500 is down 3.8% so far this month and GE is up 1.5% after a big surge on Tuesday... Read More
Don't Ignore This Chart! May 14, 2019 at 11:17 AM
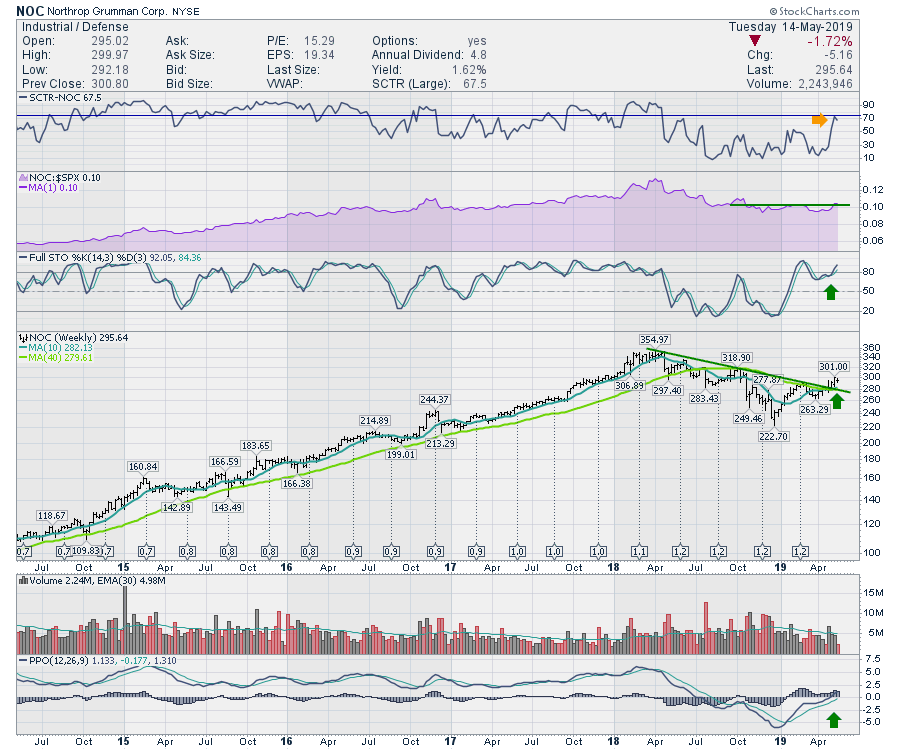
In a market with 240-point swings based on 240-character tweets, it can be pretty hard to pick a direction. While the market churns through this current trade debate, we have a few more such debates on tap with Europe and Japan... Read More
Don't Ignore This Chart! May 13, 2019 at 07:27 AM
The S&P 500 was down 2% last week and the Nasdaq fell 3%. Stocks that gained on the week showed relative and absolute strength. Stocks that fell less than 2% showed relative strength... Read More
Don't Ignore This Chart! May 10, 2019 at 01:27 PM
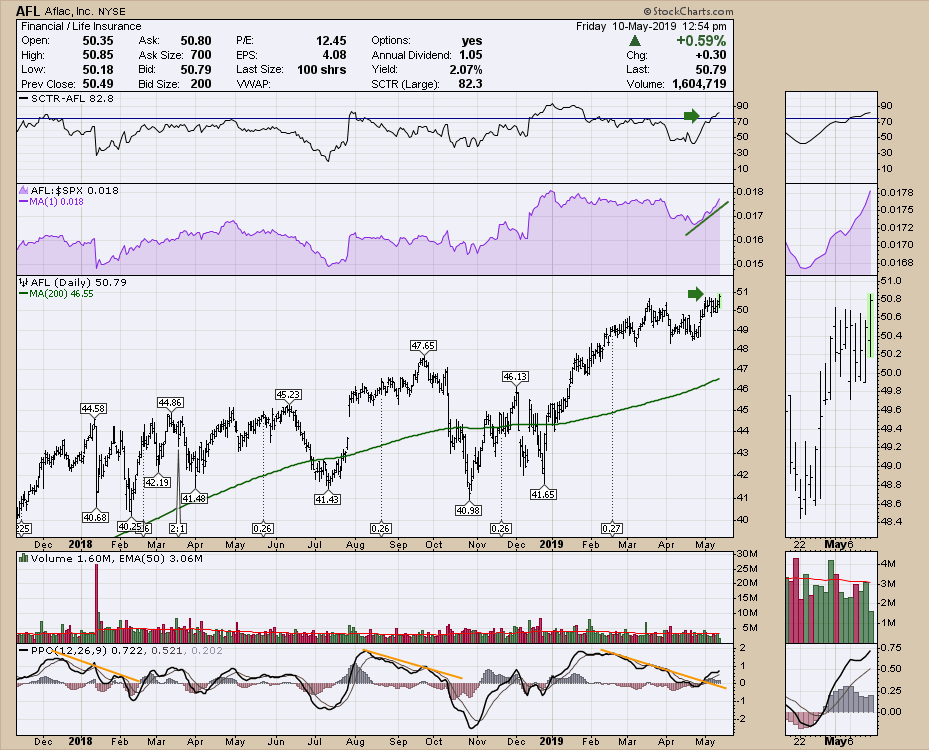
With all the news this week regarding trade, some stocks just quietly fly under the radar. This week, it was Aflac (AFL). While the market made lower lows almost every day this week, Aflac made its lows on Monday and its high on Friday. I like seeing that relative strength... Read More
Don't Ignore This Chart! May 09, 2019 at 06:11 AM
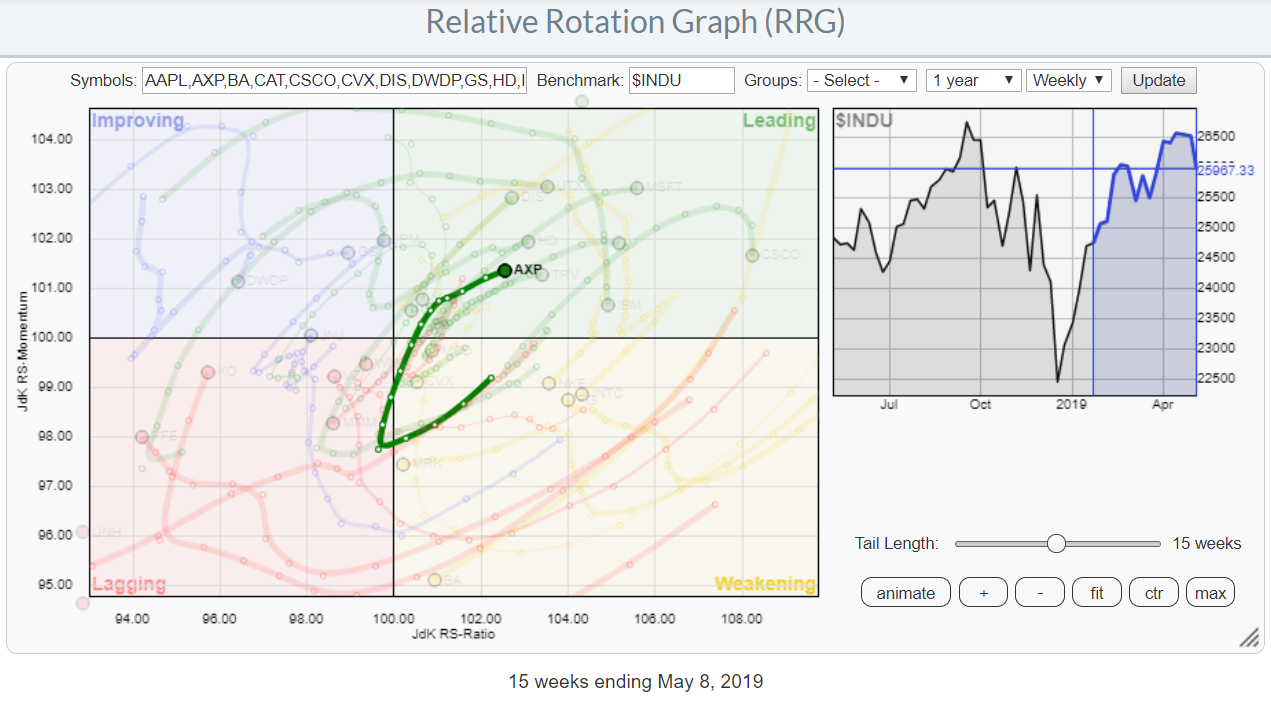
Watching the Relative Rotation Graph for the DJ-Industrials universe, you can see a few stocks, like AAPL, BA and WBA, that stand out immediately. Despite the current setback in the market, there are still some stocks that are worth approaching from a buyer's perspective... Read More
Don't Ignore This Chart! May 08, 2019 at 08:38 AM
A basic concept of technical analysis is that broken support turns into future resistance. This concept is proving true for Micron (MU) as it returned to broken support in April and backed off the last two weeks... Read More
Don't Ignore This Chart! May 07, 2019 at 01:16 PM
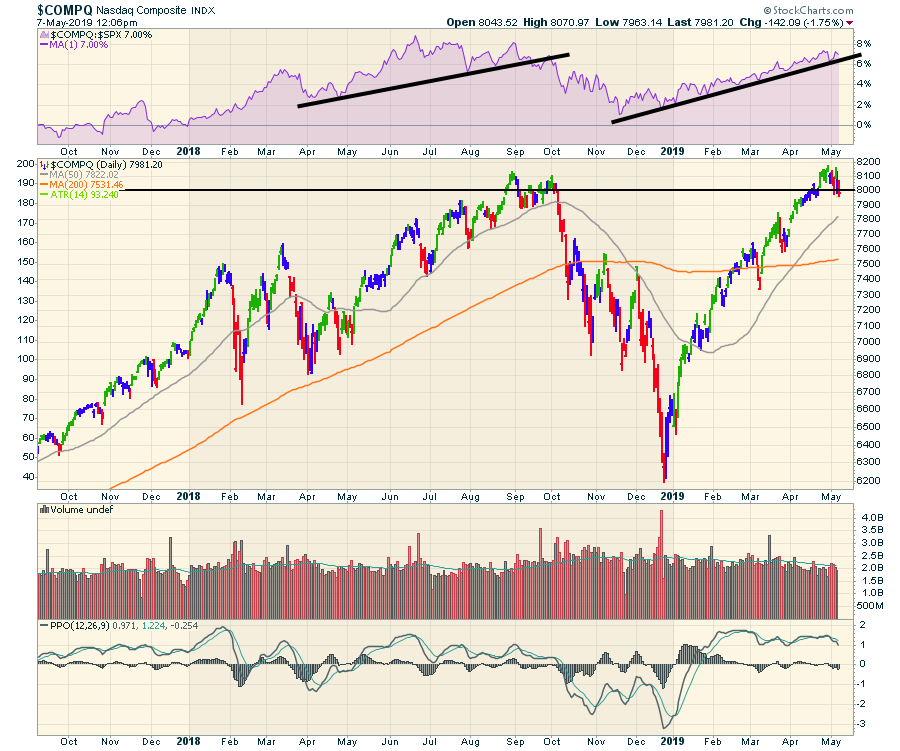
Looking at the broad composite charts below, we can see that both the Nasdaq and NYSE Composites are at important resistance points... Read More
Don't Ignore This Chart! May 06, 2019 at 11:09 AM

Ebay (EBAY) reversed its downtrend with a reversal pattern and break above the 200-day SMA in late January and early February. After digesting its gains with a corrective pattern in March-April the stock broke out again with a gap and appears headed higher... Read More
Don't Ignore This Chart! May 03, 2019 at 12:43 PM
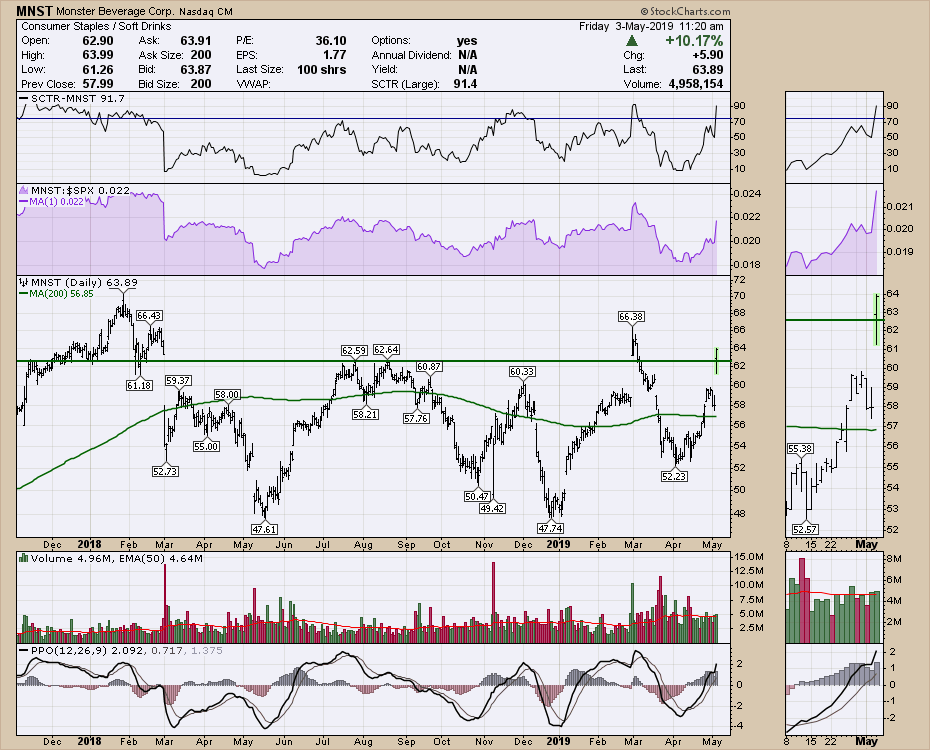
Monster (MNST) reported great numbers, beating on both earnings and revenue. What makes the chart valuable is that, after all is said and done, we can see that price is moving above the centre of the range. The real story here is that MNST has been flat money for the last 1... Read More
Don't Ignore This Chart! May 02, 2019 at 08:24 AM
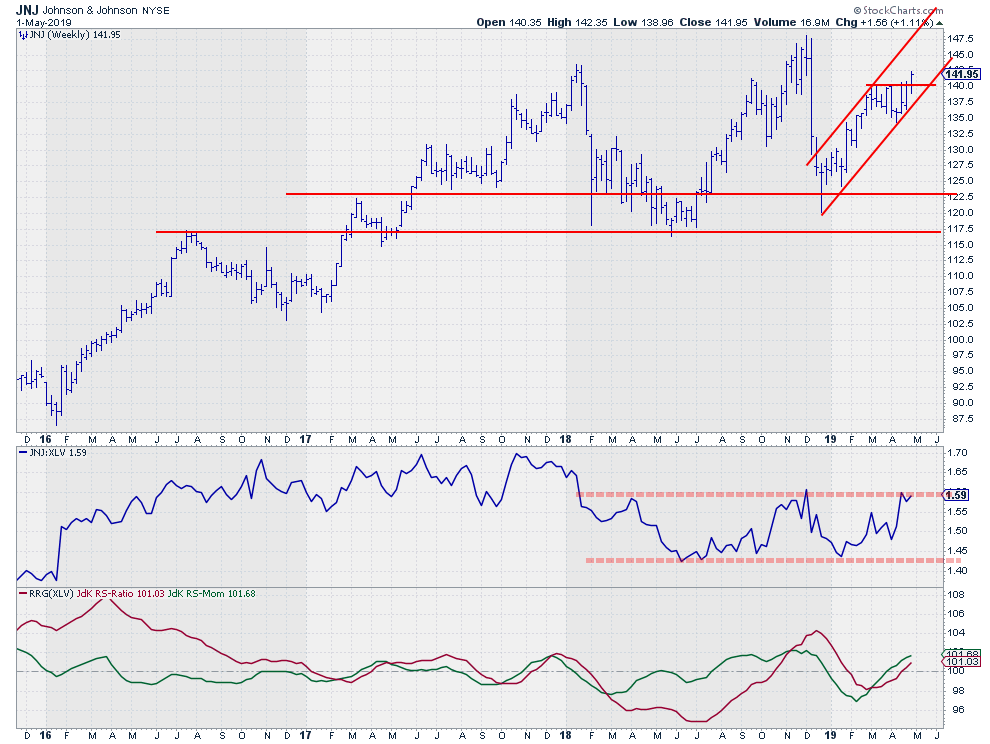
The Healthcare sector is not in its best shape. On the Relative Rotation Graph for US sectors, XLV is deep down inside the lagging quadrant against SPY, without any signs of improvement at the moment... Read More
Don't Ignore This Chart! May 01, 2019 at 06:24 AM

Docusign (DOCU), a company that provides e-signature solutions, started trading on August 27th and surged over 30% on its IPO. The stock advanced another 65% after this initial gain and then fell back to the IPO price in October... Read More