 It seems I did not have to look very far to find today's DITC entry...
The S&P 500 ($SPX) provides enough ammunition to get excited - or maybe worried is a better word - and not ignore the price action that is unfolding at the moment.
Looking at the 6-month chart of the index, the contours of a head-and-shoulders top formation can be distinguished. Is it a perfect H&S? Probably not. Does it have enough validity to not be ignored? Definitely.
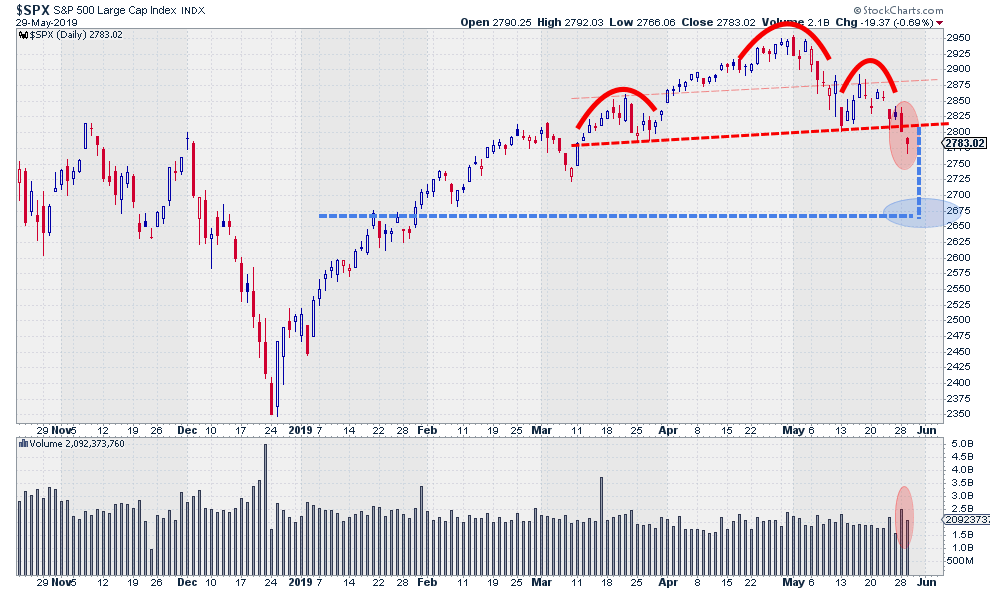 The rally out of the December low ended at the high on the 1st of May, when a more serious decline took the S&P back to 2800.
The first indication of weakness emerged when the next rally was unable to push back to the previous high, with a new high instead being put into place near 2900, significantly lower than the high at 2954 on 1 May.
From that lower high, the market started to decline again, resulting in a very weak day on 28 May with a low dangerously close to the slightly up-sloping support line that connects the arm-pits of the H&S formation. Yesterday's gap down definitely broke that level and completed the formation. Whether you subscribe to the H&S formation or not, it definitely is a weak move, kicking off a new series of lower highs and lower lows.
Building on the premise of an H&S being put into place, we can calculate the expected price target for the ensuing move by projecting the height of the pattern down from the break-level. This leads to an expected decline towards 2675 (roughly 5%). The spike in volume on the last two (weak) days support the case for a completed H&S.
5% is not a massive decline (yet) but, in the bigger scheme of things, it looks as if we are putting a fairly major peak into place - and things can easily go from weak to worse. In any case, warning lights are flashing!!
My regular blog is the RRG Charts blog. If you would like to receive a notification when a new article is published there, simply "Subscribe" with your email address.
Julius de Kempenaer
Senior Technical Analyst, StockCharts.com
Creator, Relative Rotation Graphs
Founder, RRG Research
Want to stay up to date with the latest market insights from Julius?
– Follow @RRGResearch on Twitter
– Like RRG Research on Facebook
– Follow RRG Research on LinkedIn
– Subscribe to the RRG Charts blog on StockCharts
Feedback, comments or questions are welcome at Juliusdk@stockcharts.com. I cannot promise to respond to each and every message, but I will certainly read them and, where reasonably possible, use the feedback and comments or answer questions.
To discuss RRG with me on S.C.A.N., tag me using the handle Julius_RRG.
RRG, Relative Rotation Graphs, JdK RS-Ratio, and JdK RS-Momentum are registered trademarks of RRG Research.
