 The Healthcare sector is not in its best shape. On the Relative Rotation Graph for US sectors, XLV is deep down inside the lagging quadrant against SPY, without any signs of improvement at the moment. However, if you feel that this situation will not last forever and are gutsy enough to prepare a bit for a turnaround, you may want to look at JNJ.
Price
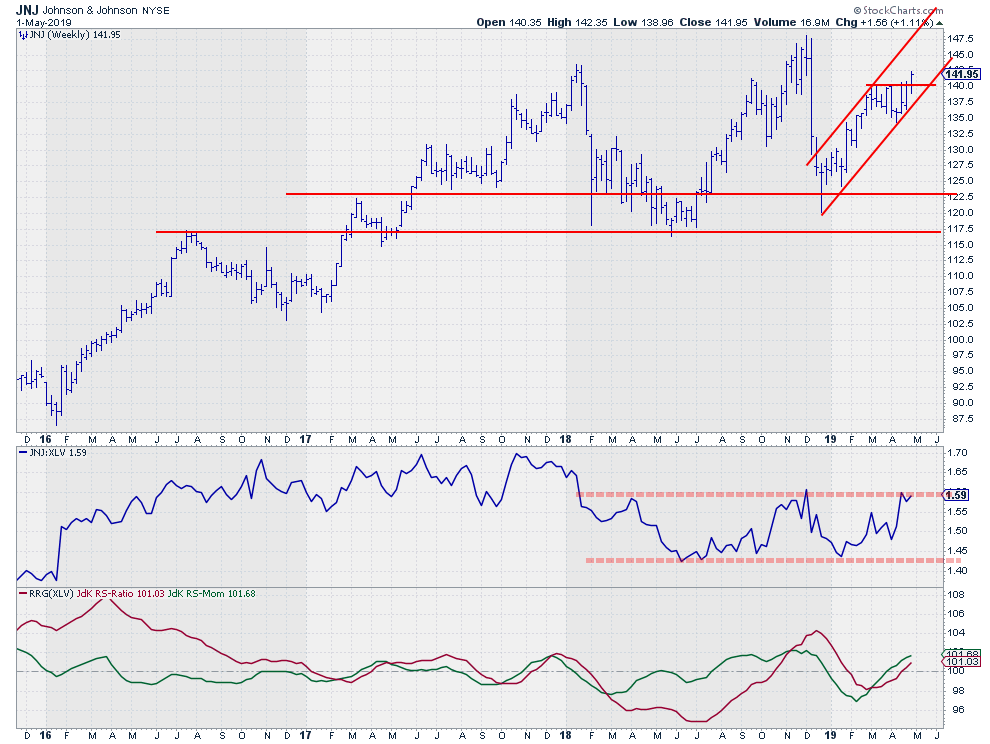
On the weekly price chart above, JNJ looks to be clearing horizontal resistance around $140. There are still two days left in the week, but things look good so far.
The next hurdle(s) on the price chart are not far away, but they are also not very clearly visible. What I'm saying is that these prior highs (resistance levels) are not neatly lined up but clustered between $149 - $148, with $148 being the last serious high that needs to give way for JNJ to reach new highs.
On the daily chart, $140 was more clearly defined as a resistance level; that level was broken yesterday. This means that, over the coming days, this level should be watched as support in case of declines and a possible springboard for an attempt to go beyond $148.
Relative
From a relative point of view, JNJ against XLV is pushing against the upper boundary of a range that has been in play since early 2018. If the stock can also take out this overhead barrier, it will be in even better shape within the universe of Health Care stocks.
The current status of the RRG-Lines, both above 100 on the weekly chart and rising, positions JNJ inside the leading quadrant at a strong RRG-Heading.
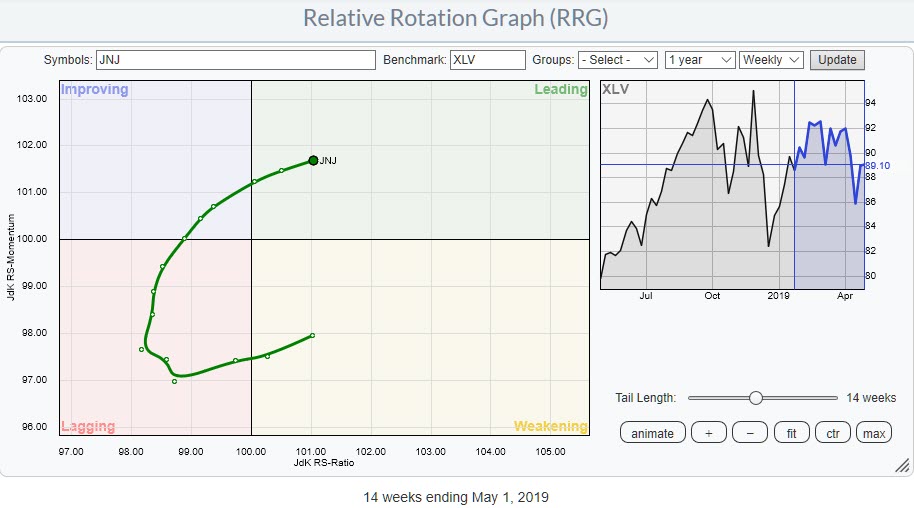
(As-)If-And-When the Health Care sector starts to show signs of improvement, JNJ will very likely be one of the leading stocks driving that sector. Since JNJ makes up more than 10% of the sector (XLV), this can be expected to have an impact on the performance of the sector as such.
My regular blog is the RRG Charts blog. If you would like to receive a notification when a new article is published there, simply "Subscribe" with your email address.
Julius de Kempenaer
Senior Technical Analyst, StockCharts.com
Creator, Relative Rotation Graphs
Founder, RRG Research
Want to stay up to date with the latest market insights from Julius?
– Follow @RRGResearch on Twitter
– Like RRG Research on Facebook
– Follow RRG Research on LinkedIn
– Subscribe to the RRG Charts blog on StockCharts
Feedback, comments or questions are welcome at Juliusdk@stockcharts.com. I cannot promise to respond to each and every message, but I will certainly read them and, where reasonably possible, use the feedback and comments or answer questions.
To discuss RRG with me on S.C.A.N., tag me using the handle Julius_RRG.
RRG, Relative Rotation Graphs, JdK RS-Ratio, and JdK RS-Momentum are registered trademarks of RRG Research.
