The frustration of watching the market trade sideways for a year goes on. After the Fed meeting and Options Expiration, the market has wandered sideways yet again; from Tuesday's close to the following Thursday close, the market is up 0.25%. I am currently looking for setups near support and oversold conditions that could bounce while keeping a tentative eye on the new highs list.
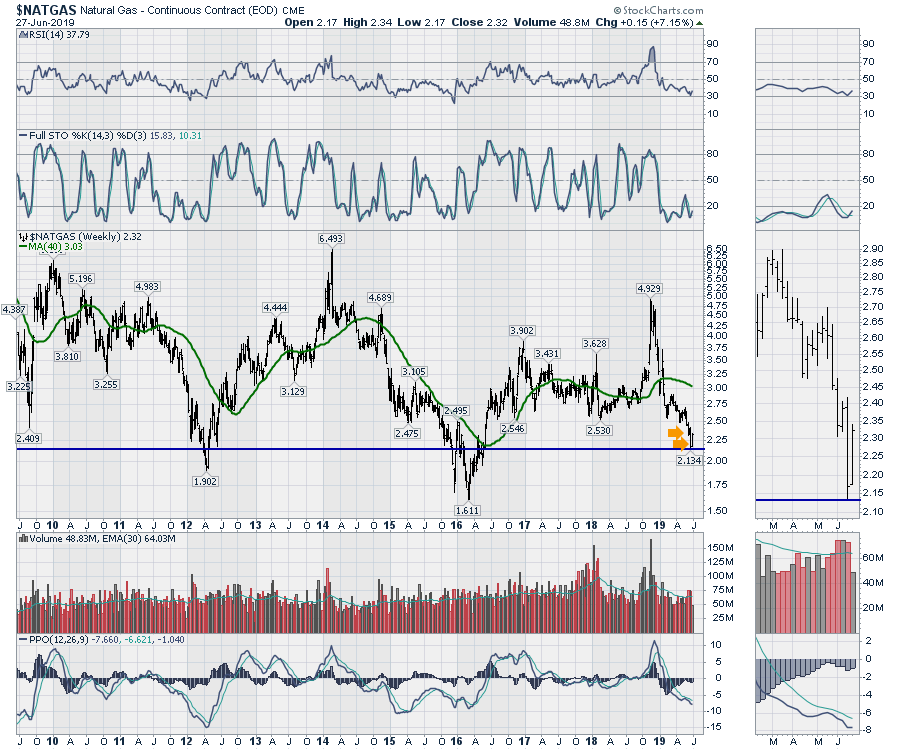
One of the charts that pops up is the Natural Gas chart. The reason this chart is interesting is that the price is near 10-year lows. Looking in on the zoom panel, a few reversal bars are showing up. Three weeks ago, there was an inside bar where price traded inside the range of a big down week. This can be associated with an exhaustion low, where the falling price momentum stalls and tries to turn up. That candle was followed by another significant drop the week of June 17th, nullifying the setup. However, this week, price is creating another inside bar. As the move is already 7% higher, this looks like another potential reversal pattern.
One of the reasons to focus in on this low is the size of the move that comes out of these extreme lows. All three of the previous lows created a move of double over the next few quarters. The full stochastic has turned up to give us another signal.
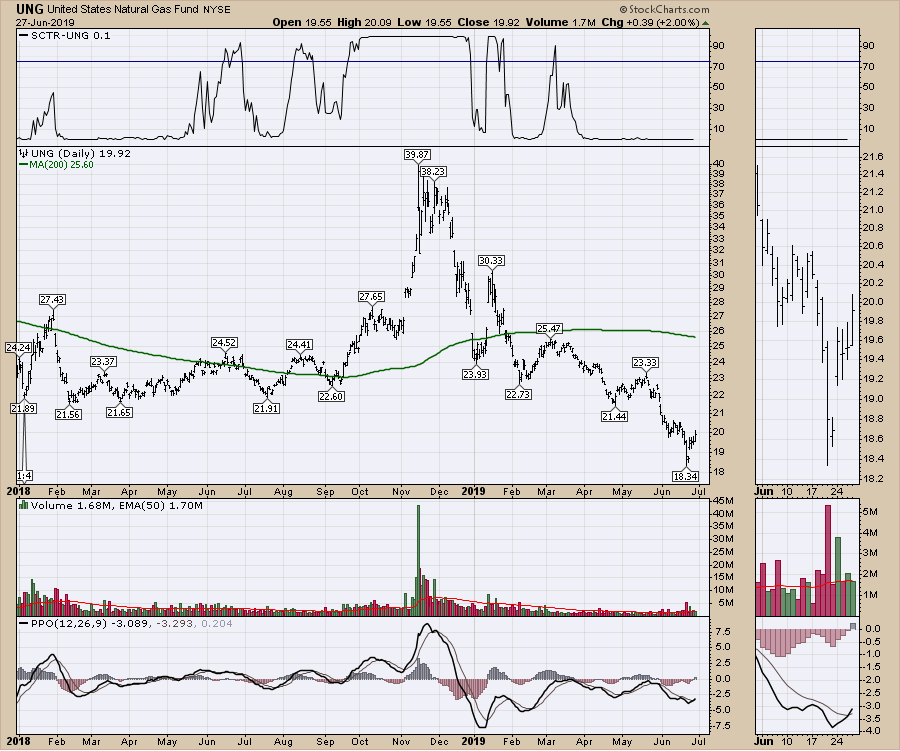
 There are many ways to play this move, but one would be using the Natural Gas ETF (UNG). While a long term hold has a huge amount of decay, short moves of a few months can work well.
The SCTR shows the ETF as a terrible performer, but the sudden spikes are worthy swing trades. This week, the volume is starting to surge to 5-month highs on the actual low, which looks like capitulatory volume. This was not present on the previous setup earlier in June.
 If you are looking for some quick swing trades, Natural Gas will test your ability to trade price action. This is a nice set up for aggressive traders, but it is definitely not a buy-and-hold trade for slower trade placement. Close attention is required.
Good trading,
Greg Schnell, CMT, MFTA
Senior Technical Analyst, StockCharts.com
Author, Stock Charts For Dummies
Want to stay on top of the market's latest intermarket signals?
– Follow @SchnellInvestor on Twitter
– Connect with Greg on LinkedIn
– Subscribe to The Canadian Technician
