Raymond James Financial is setting up nicely here to surge higher, as seen in the chart below. However, it is also at an important inflection point where we can set a tight stop if it does break down.
The relative strength (in purple) needs to move up here. When a stock breaks to new 52-week lows in relative strength, this can be a reason for an institutional shop to lighten up on the position size, leading to more selling.
The full stochastic bouncing near 50 is a bullish trait, so we should be prepared for an upside move and we can be buying into the stock as it starts. If it rolls back down here, that is usually a signal where the stock will quickly drop, reinforcing the importance of the inflection point we are at. As an example, July 2018 shows a pivot followed by a drop near 50 on the full stochastic. That was the start of a long drop.
The price is very close to the uptrend line, which means we also have an important support line in play. The move above the 10-week moving average is also bullish, as the stock had been trapped under the average since May.
Additionally, the PPO is trying to turn up above zero. That is a nice place to get onboard, as good moves can start with momentum turning up. If it fails here and drops, we want to be out quickly.
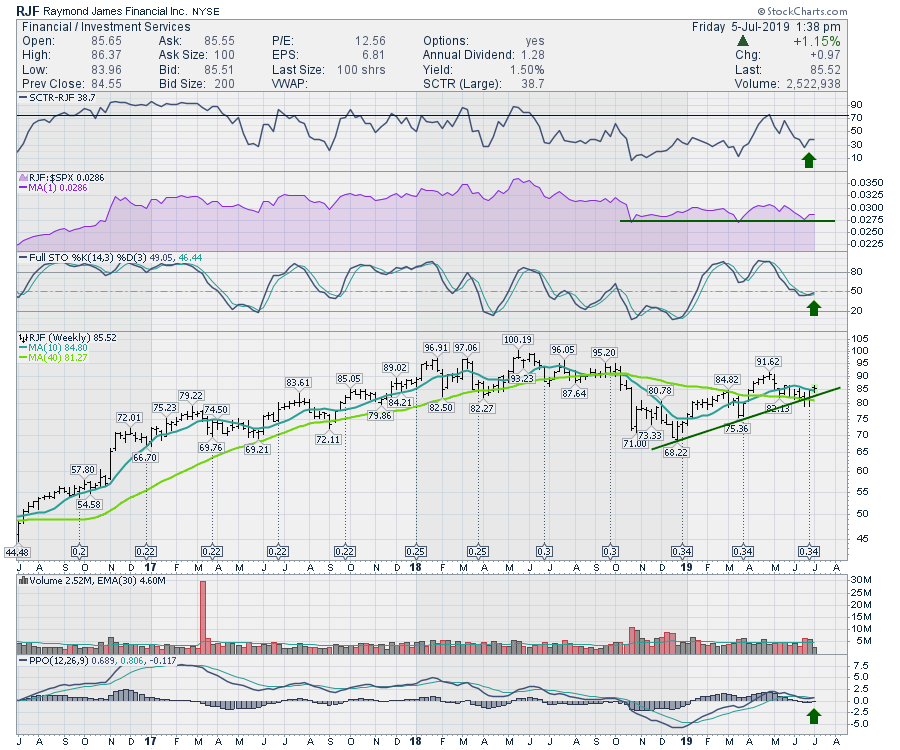 On that note, this trade happens to be in close proximity to a good stop out. That means we can control our risk and be early in the move to the upside.
In Friday's Market Buzz, I mentioned that the financials are set up to move higher here. If they don't follow through, that would be concerning as I'd expect the group to start moving lower aggressively. I am ready to ride a move to the upside, but any negative developments would have me stepping out of the way to avoid the shovels digging into a move lower.
Good trading,
Greg Schnell, CMT, MFTA
Senior Technical Analyst, StockCharts.com
Author, Stock Charts For Dummies
Want to stay on top of the market's latest intermarket signals?
– Follow @SchnellInvestor on Twitter
– Connect with Greg on LinkedIn
– Subscribe to The Canadian Technician
