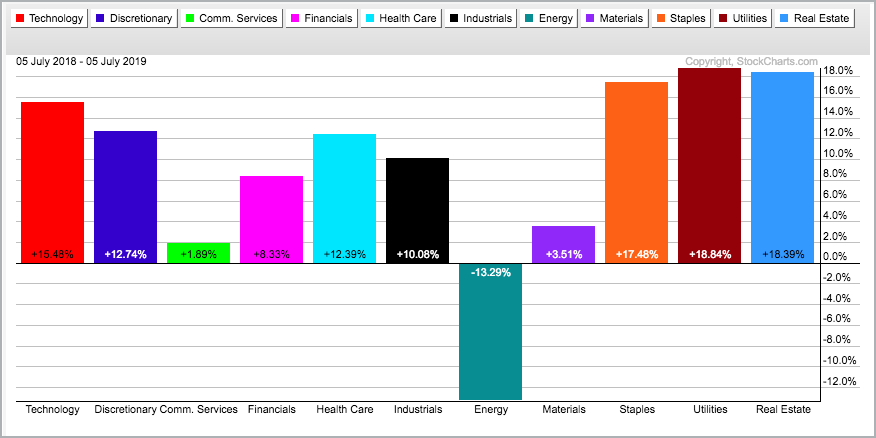
Stocks that hit new highs are in clear uptrends and show upside leadership. A new high does not have to be within a few days or even a few weeks. Sometimes stocks hit new highs and then correct for a few months to digest prior gains. It is all part of the ebb and flow of an uptrend. Corrections provide opportunities to participate in uptrends before the next round of new highs. AES Corp (AES), a utility stock, appears to be ending its correction and resuming its uptrend. In a separate, but related note, the PerfChart below shows XLU leading the 11 sector SPDRs with the biggest gain over the past year.
AES recorded a new high in late March and then fell with a decline into late May. The decline lasted around 2 months and carried the stock back to the rising 200-day SMA. The overall trend remained up because the stock held its rising 200-day SMA and the 50-day EMA remained well above the 200-day EMA (see PPO(50,200,0) in lower window).
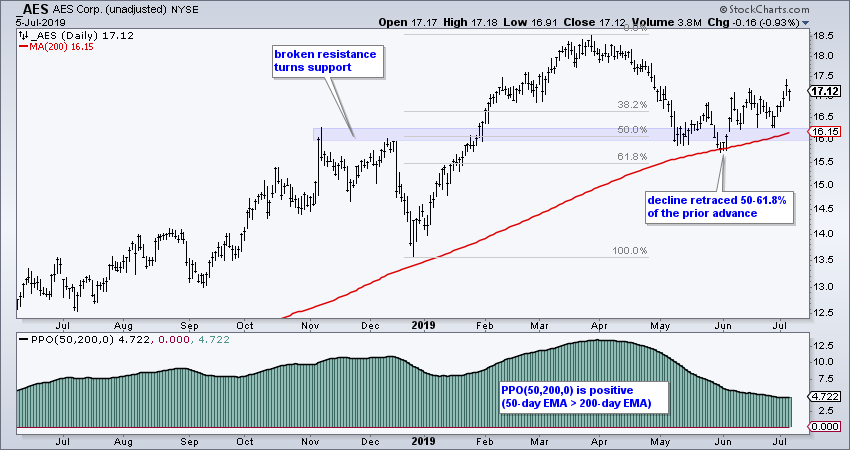
The reversal in the 16 area was not totally unexpected. First, the decline retraced 50-61.8% of its prior advance. This amounts to two steps forward (late December to late March) and one step backward (late March to late May). Second, a classic tenet of technical analysis is that broken resistance turns into support. The blue zone shows the resistance zone in the 16 area turning into support.
I view the April-May decline as a mere correction within a bigger uptrend. Moreover, there are signs that this correction is ending as the stock turns up and breaks above its June highs. A resumption of the bigger uptrend points to new highs in the coming weeks and months. I would re-evaluate this bullish prognosis on a close below 16.
On Trend on YouTube (Tuesday, July 2nd)
- Market Condition Matters
- Cannabis Stocks Reach Reversal Alert Zones
- Diving into the Cyber Security Group
- Oil and XLE Hit Resistance Zones
- Retail Stocks Still Suffering
- Click here to Watch
Arthur Hill, CMT
Senior Technical Analyst, StockCharts.com
Author: Define the Trend and Trade the Trend
Paper: RSI for Trend-Following and Momentum Strategies
Want to stay up to date with the latest market insights from Arthur?
– Follow @ArthurHill on Twitter
– Subscribe to Art's Charts
– Watch On Trend on StockCharts TV (Tuesdays / Thursdays at 10:30am ET)
