The Biotech ETFs, XBI and IBB, have underperformed the broader market the entire year. The chart below shows the S&P 500 SPDR (SPY) with higher highs in early May and July. The ETF also recorded fresh 52-week highs in May and July. The Biotech iShares (IBB) and Biotech SPDR (XBI), on the other hand, did not come close to their September-October highs and did not even make it back to their spring high (red lines). XBI and IBB were showing relative and absolute weakness when SPY was hitting new highs and this is quite negative for the group.
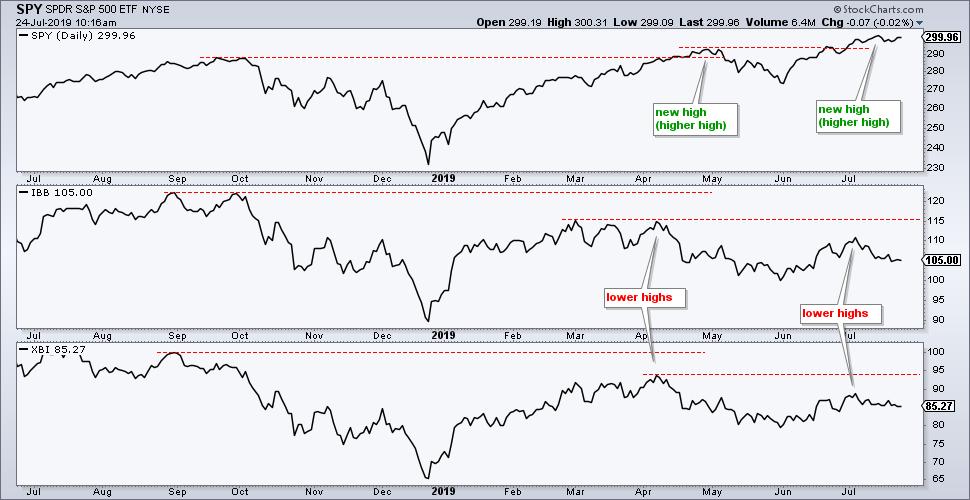 SPY, IBB and XBI
The next chart shows BioMarin (BMRN) with two descending triangles, which are classic bearish continuation patterns. The lower highs reflect increased selling pressure at lower price points. The equal lows mark the demand line where buyers stepped in over the last few months. A break below this demand line (support) would confirm the pattern and argue for a continuation of the existing downtrend.
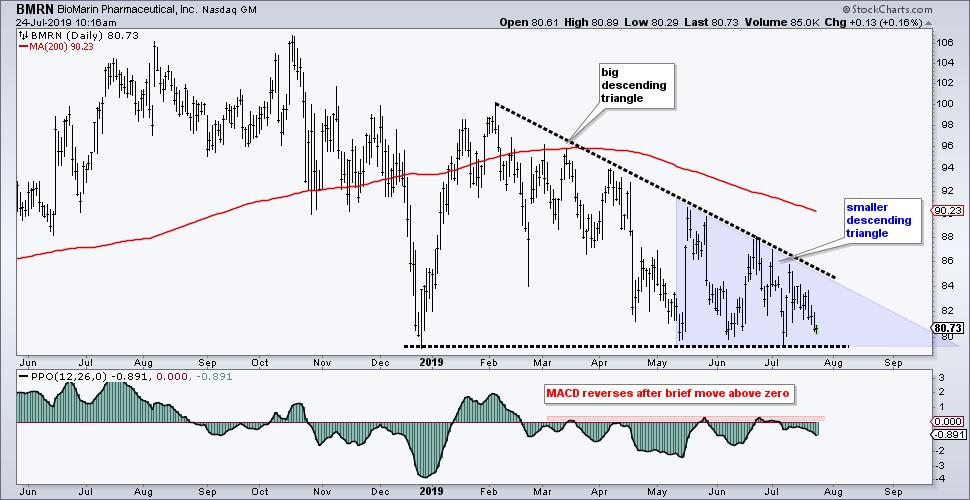 BMRN
BMRN
Before getting too bearish, note that I am not into shorting stocks and the stock is still near support. BioMarin also reports on August 1st and anything can happen with earnings. Nevertheless, biotechs as a group are lagging with lower highs in 2019 and BioMarin is on the verge of a 52-week low. This group should be avoided for now.
On Trend on YouTube
Tuesday's show features a trading strategy using Bollinger Bands and Aroon to identify a consolidation period, and then Aroon to identify the next directional signal. There are examples using IWM and MDY. I will also cover the banking ETFs (KRE, KBE) and some of the too-big-to-fail banks (BAC, C, JPM, MS, GS). This episode includes scan code for the BandWidth/Aroon setup around the 20min mark. I will end with five stock setups and these stocks do not report earnings until September/October.
Choose a Strategy, Develop a Plan and Follow a Process
Arthur Hill, CMT
Chief Technical Strategist, TrendInvestorPro.com
Author, Define the Trend and Trade the Trend
Want to stay up to date with Arthur's latest market insights?
– Follow @ArthurHill on Twitter
– Subscribe to Art's Charts
