 If you can keep your head when all about you are losing theirs ....Rudyard Kipling
The line above comes from the Poem, "If" by Rudyard Kipling. We can rephrase this when looking at stocks over the last few weeks.
If a stock can hold above the late July low and break out when others are breaking down ... Arthur Hill
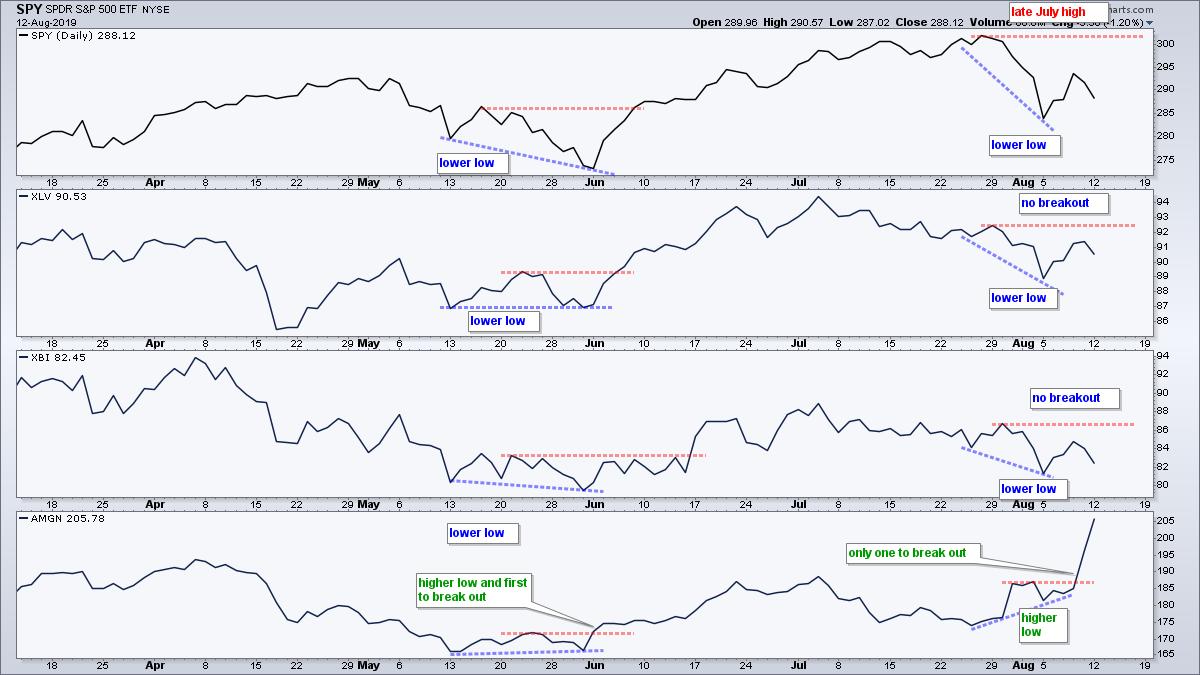
The late July low and high serve as benchmark levels that chartists can use to compare chart performance. The first chart shows the S&P 500 SPDR (SPY), Health Care SPDR (XLV), Biotech SPDR (XBI) and Amgen (AMGN). SPY, XLV and XBI moved sharply lower in early August (blue lines) and did not break their late July highs with the rebound last week. Amgen, on the other hand, formed a higher low from late July to early August and broke above its late August high with a surge last week. Amgen held its low when all around were moving lower and broke above its prior high when all around remained well below their prior highs. Notice that a similar situation occurred in May.
Click here for a short Youtube video explaining this commentary.
The next chart shows Amgen reversing near the 50% retracement and breaking out with above average volume last week. AMGN advanced from 125 to 205 with a zigzag higher over a two year period. The decline in 2019 retraced around half of this advance with a falling channel. Both the pattern and the retracement are typical for corrections within bigger uptrends (think two steps forward and one step backward).
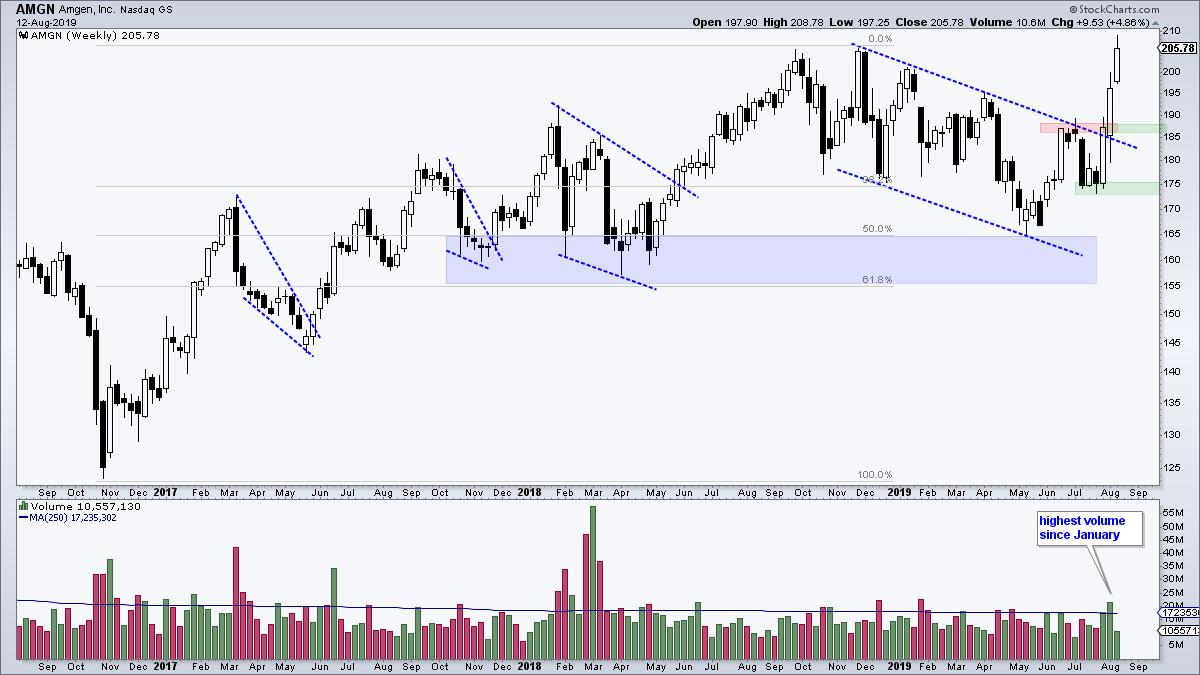
The stock ended this correction with a surge and breakout over the last two weeks. Notice that volume on the advance was the highest since January. The breakout zone in the 185-186 area turns first support to watch on a throwback. The July lows mark key support going forward. A break below these lows would call for a reassessment of this bullish thesis.
------------------------------------------------------------
Choose a Strategy, Develop a Plan and Follow a Process
Arthur Hill, CMT
Chief Technical Strategist, TrendInvestorPro.com
Author, Define the Trend and Trade the Trend
Want to stay up to date with Arthur's latest market insights?
– Follow @ArthurHill on Twitter
– Subscribe to Art's Charts
