Last Tuesday 11/3, Election Day, I joined Dave Keller on The Final Bar. Most likely because all potential US-based guests were busy doing something else ;)
Dave and I talked about the Stock/Bond rotation going into the elections and how that lined up with the 2016 elections. We also had a look at the steepening yield curve in combination with the S&P 500.
 While we were talking, we both chuckled on the rotation of the energy sector (XLE), which crossed into the lagging quadrant in September 2018 and has not managed to come back to the right side of the RRG ever since. From a rotational perspective, this is, and has been, the easiest call to make for quite a while now.
However, you need to keep an open mind. Because, just as "everything that goes up must come down," the reverse is also (almost) always true - that what has come down, will come back up..... at some stage.
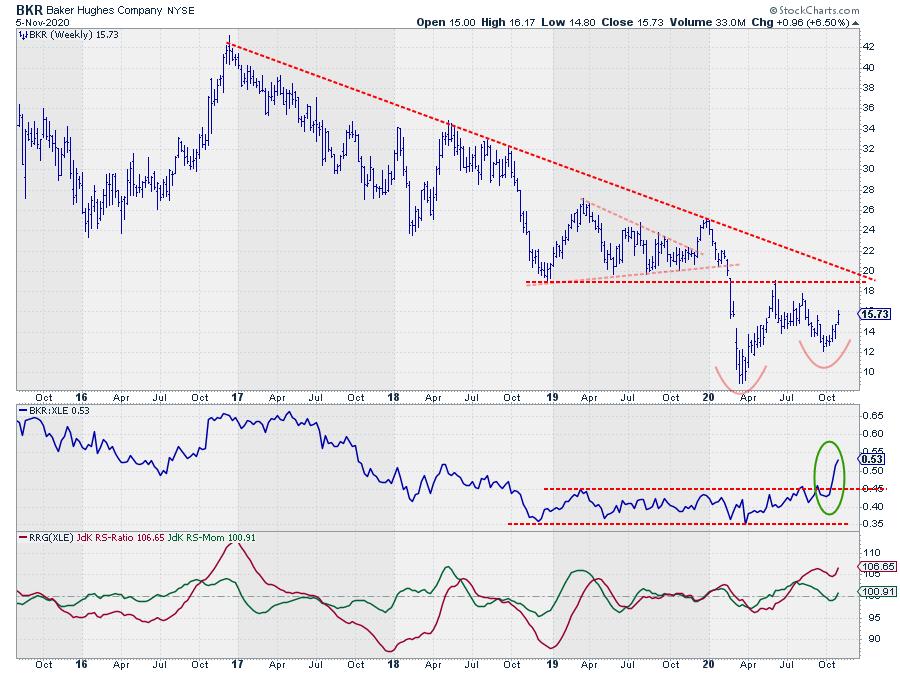
For the sector as a whole, I don't see that happening anytime soon, but today, while browsing through some sector RRGs (the individual stocks against their respective sector benchmarks), I noted an interesting rotation for Baker Hughes (BKR). After an initial rotation through leading from early July 2019 until early October 2020, BKR rotated into the lagging quadrant, but is now rapidly reversing back into leading. (Be aware, this is against XLE as the benchmark, NOT the S&P 500.)
Looking at the chart at the top of this article, the trend in price is still clearly down, but, from a positive perspective, it looks as if a first higher low has been put into place. Heavy overhead resistance is waiting in the $19-$20 area, where the falling resistance meets the horizontal resistance coming off the 2019 lows.
The relative strength chart is sending better news in the form of an upward break out of a two-year range. The initial improvement in RS was picked up by the RRG-lines in July. The two tests and subsequently flat move against resistance in September caused JdK RS-Momentum roll over and shortly dip below 100, causing the rotation through weakening.
The recent break out of the range is now sending relative strength higher and pushing the RRG-Lines further up, while the BKR tail is going deeper into the leading quadrant. The relative improvement against XLE is clearly visible and, on the price chart, there is room near resistance in the $19-$20 area.
Despite the fact that the Energy sector is still the weakest sector in the S&P 500, this could the early bird... at least inside the sector!
#StaySafe, --Julius
My regular blog is the RRG Charts blog. If you would like to receive a notification when a new article is published there, simply "Subscribe" with your email address.
Julius de Kempenaer
Senior Technical Analyst, StockCharts.com
Creator, Relative Rotation Graphs
Founder, RRG Research
Host of: Sector Spotlight
Please find my handles for social media channels under the Bio below.
Feedback, comments or questions are welcome at Juliusdk@stockcharts.com. I cannot promise to respond to each and every message, but I will certainly read them and, where reasonably possible, use the feedback and comments or answer questions.
To discuss RRG with me on S.C.A.N., tag me using the handle Julius_RRG.
RRG, Relative Rotation Graphs, JdK RS-Ratio, and JdK RS-Momentum are registered trademarks of RRG Research.
