The Indian Equity Markets spent the entire week on expected lines. The previous week was expected to be turbulent, and the zone of 10600-10750 was set to pose stiff resistance to the Markets. On these analyzed lines, the NIFTY continued to remain volatile all throughout the week. The benchmark Index finally ended the week posting a modest gain of 97 points (+0.92%).
NIFTY faced stiff resistance over the previous week in the 10600-10750 zones and failed to decisively extend the pullback.
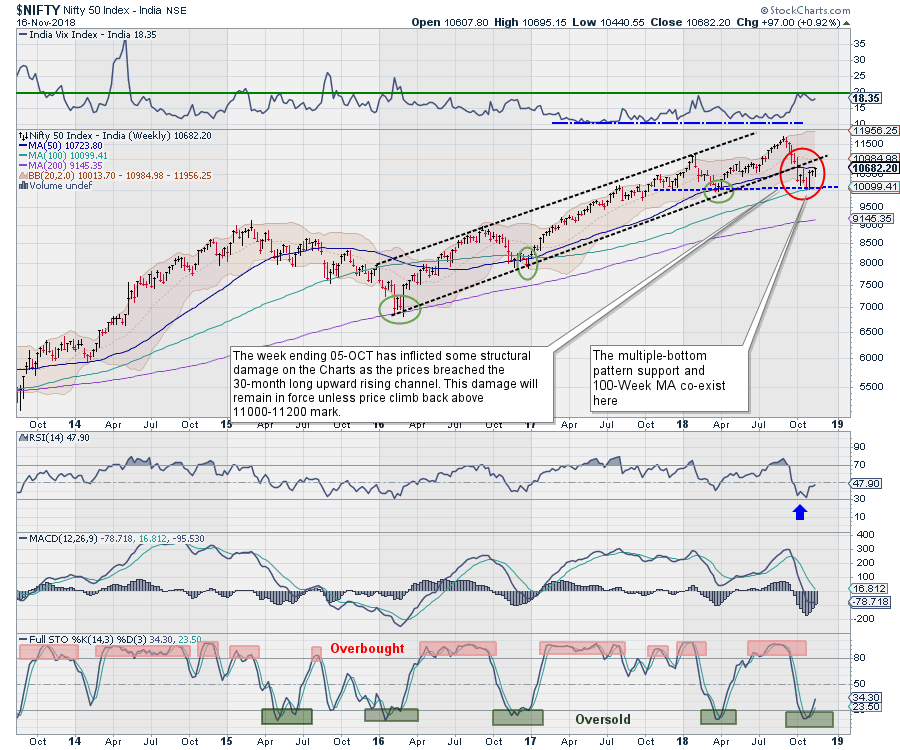 This 150-point zone of 10600-10750 will continue to remain critically important to watch in the coming week. Also, the 50-Week Moving Average which is presently at 10723, is also expected to remain important for the Markets. NIFTY has been facing resistance at the 50-Week MA level since last five weeks; in order for NIFTY to make any decisive continuation of a pullback, moving past this level would be important.
The coming week is likely to see the levels of 10750 and 10830 as immediate resistance levels for the markets. Supports come in lower at 10550 and 10440 zones.
The Weekly RSI, which is presently at 47.9015, is neutral and shows no divergence against the price. Weekly MACD remains bearish while trading below its signal line. Apart from a small white body that emerged, no significant formations were observed on Candles.
While performing a pattern analysis on the weekly charts, it can be observed that NIFTY has taken a strong triple bottom support near 10000-mark and has pulled back from there. This pullback has been stalled at the 50-Week Moving Average which is presently at 10723. This was a support for the NIFTY earlier and it is now acting as the resistance on its way up.
If we are to take a critical view on the Markets, the NIFTY presently remains in middle of a very turbulent 150-point zone of 10600-10750. Until this zone is effectively breached on the upside, there will be no meaningful extension of pullback from current levels.
The 10600-10750 zone has major overhead resistance points for the Markets. They come in form of a 50-Week MA at 10723 and confluence of 50-DMA and 200-DMA on the Daily Charts at 10750 and 10754 respectively. Therefore, the process of moving past this zone is likely to prove to be difficult and laborious for the Markets.
In the given circumstances, unless these overhead multiple resistances are penetrated effectively in the short week ahead (Friday is a trading holiday), we recommend maintaining focus on protection of profits at higher levels, as the markets will continue to remain vulnerable to profit-taking bouts from higher levels.
Sector Analysis for the coming week
In our look at Relative Rotation Graphs, we compared various sectors against CNX500, which represents over 95% the free float market cap of all the stocks listed.
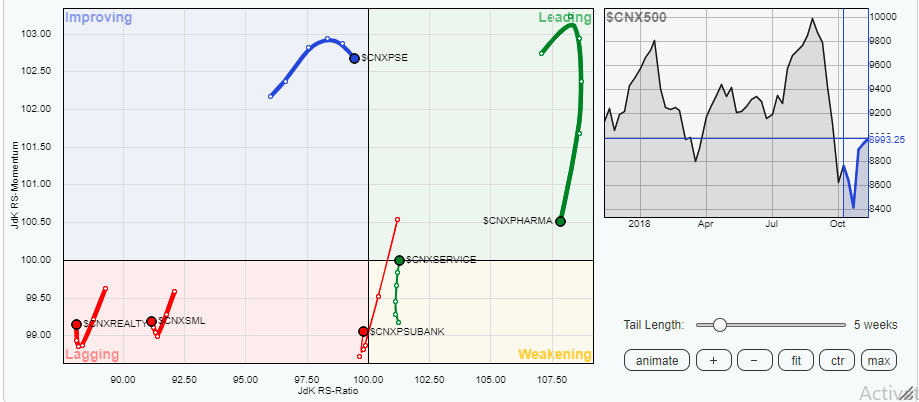
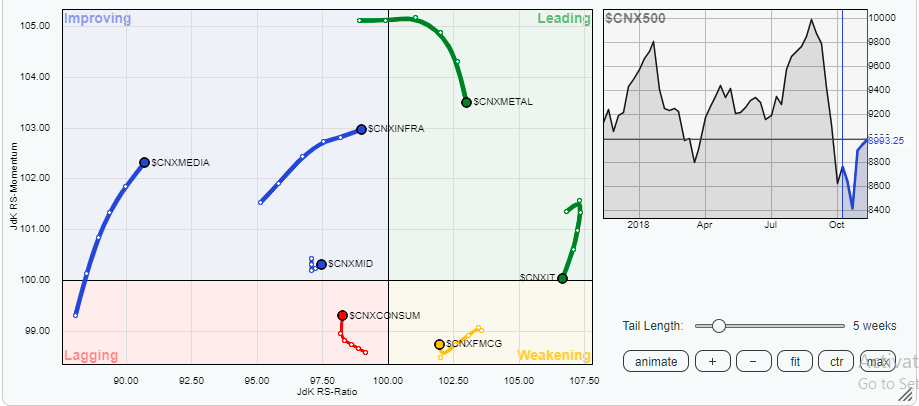
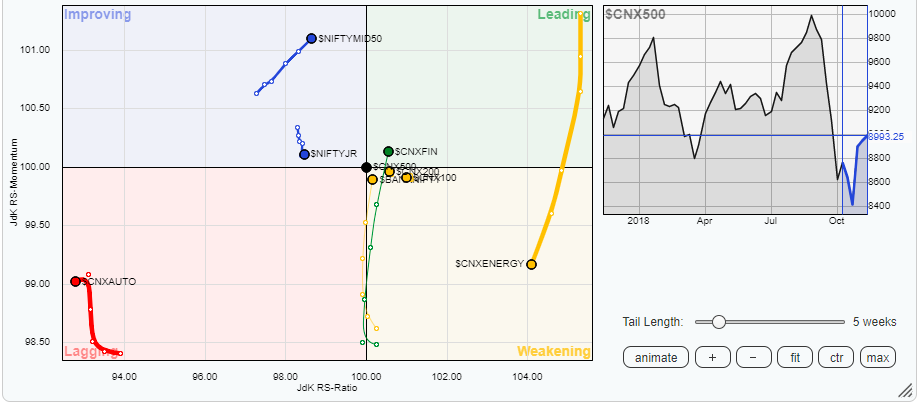 While inspecting Relative Rotation Graphs (RRG), Pharma Index is seeing continued slow down on momentum. The Metal Index is also taking a breather and stalling its momentum. IT Index also has preferred to take some back seat and is about to enter the weakening quadrant. We will continue to see resilient show from Metal and Pharma Indexes despite decreasing momentum as they remain in the leading quadrant. On the other hand, the Financial Services stocks and Services Sector stocks have entered the leading quadrant after a parabolic improvement in momentum over previous weeks. Infrastructure and Media stocks remain in improving quadrant and we can expect stock specific out-performance from these groups. Bank Nifty Index too is seen continuing to improve its momentum.
All in all, we expect resilient performance from Pharma, Metals, Infrastructure, Midcaps and Private Banks in form of stock specific out-performances. Auto, Realty, Small Cap Index, PSU Banks, and FMCG are not likely to put up any extraordinary performance in coming week.
Important Note: RRG™ charts show you the relative strength and momentum for a group of stocks. In the above Chart, they show relative performance as against NIFTY500 Index (Broader Markets) and should not be used directly as buy or sell signals.
Milan Vaishnav, CMT, MSTA
Consulting Technical Analyst
www.EquityResearch.asia
