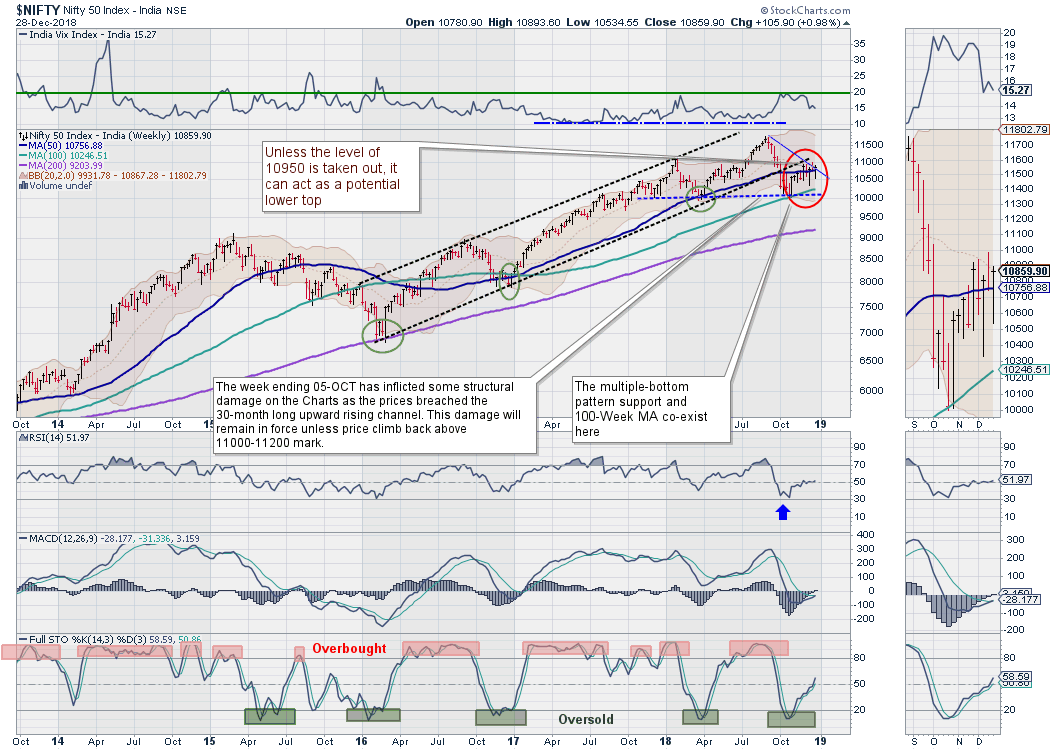
Over the past week, the markets continued to deal with overhead resistances on expected lines. Once again, it was a volatile week, with the NIFTY oscillating in a wide range as it dealt with a couple of important resistance levels on the charts. The benchmark index has attempted to penetrate the 50-Week MA, which is presently at 10756, but ultimately closed near the upper band of the week’s trading range, ending the week with net gains of 105.90 points (+0.98%).
With the last trading session of 2018 on Monday, we end an immensely volatile year. As of now, NIFTY has returned over 2% on YTD basis, a figure that, at one point of time, had peaked at over 12%.
On the weekly charts, the NIFTY continues to struggle to penetrate the pattern resistance area. The markets are presently indecisively placed and moving past 10950; it will be important to move higher.
The global environment has been extremely volatile of late. This will affect the domestic markets as well, even if they outperform on the relative basis. The coming week is expected to remain range-bound; the range may be wider given the likelihood of volatility remaining ingrained in the trade. The levels of 10950 and 11285 will act as immediate resistance area while supports will come in at 10740 and 10600.
The Relative Strength Index (RSI) on the weekly chart is 51.9718; it remains neutral and shows no divergence against the price. Weekly MACD has shown a positive crossover and is bullish, trading above its signal line. PPO has just turned positive on the weekly charts. A long lower shadow occurred on the Candles, but it remains insignificant in the context of the present structure on the charts.
The pattern analysis of the charts reveal that the NIFTY has been struggling to penetrate the overhead pattern resistance, which is in the form of a falling trend line. This falling trend line begins from the high of 11760 and joins the subsequent lower tops.
Despite the apparent bullish trajectory, it would be necessary for the NIFTY to move past 10950 and sustain itself before it can scale higher levels. Until then, markets will remain vulnerable to profit-taking from those higher levels.
Overall, NIFTY has managed to modestly penetrate the overhead pattern resistance, remaining indecisively placed. We suggest avoiding shorts or taking aggressive bets on either side. The key sectors are rotating at the moment; it would make more sense making modes purchases in such favorably rotating sectors. While chasing the momentum, protecting profits will be equally important.
In our look at Relative Rotation Graphs, we compared various sectors against the CNX500, which represents over 95% of the free float market cap of all the stocks listed.
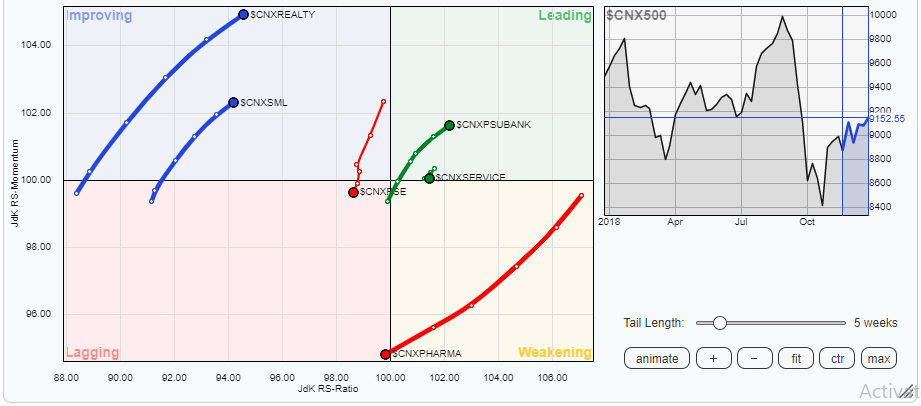
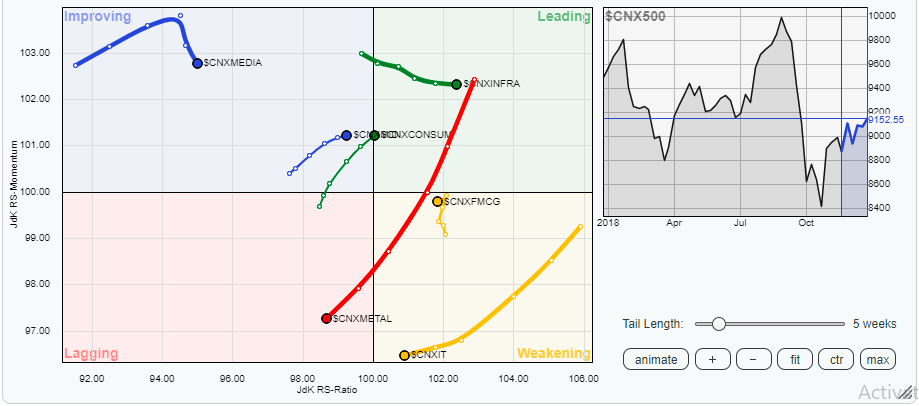
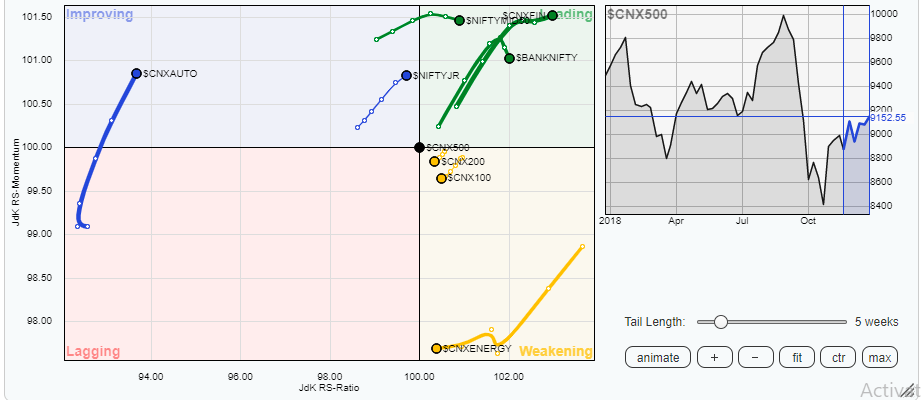
A study of the Relative Rotation Graphs (RRG) also show markets remaining indecisively placed. The PSU Bank, Financial Services, Infra and Consumption indexes remain comfortably in the leading quadrant and seem to be maintaining their momentum. This will help these groups relatively outperform the broader markets. The BankNIFTY and Services Sector indexes also remain in the leading quadrant, but their momentum appears to be stalling. We may see these groups taking a bit of a breather.
The FMCG Index, too, has stalled its up move in the previous week and retraced on its momentum. The IT Index has continued to weaken, as has the Energy Index. Metals have continued to lag in the previous week and are not likely to post any eye-catching performances, except for isolated stock-specific performance.
The Realty and Auto indexes have further advanced in the improving quadrant while consolidating strength and improving on their relative momentum against the broader markets.
Important Note: RRG™ charts show the relative strength and momentum for a group of stocks. In the above chart, they depict relative performance as against the NIFTY500 Index (Broader Markets) and should not be used directly as buy or sell signals.
Milan Vaishnav, CMT, MSTA
Consulting Technical Analyst
www.EquityResearch.asia
