Throughout the past week, the markets continued to follow the falling trend line pattern resistance. Though no major downsides were witnessed, the NIFTY did not make any major up moves either. The larger part of the previous week saw a significant number of shorts being added, but no short covering came through and the NIFTY settled with a net loss of 132.55 points (-1.22%) on a weekly basis.
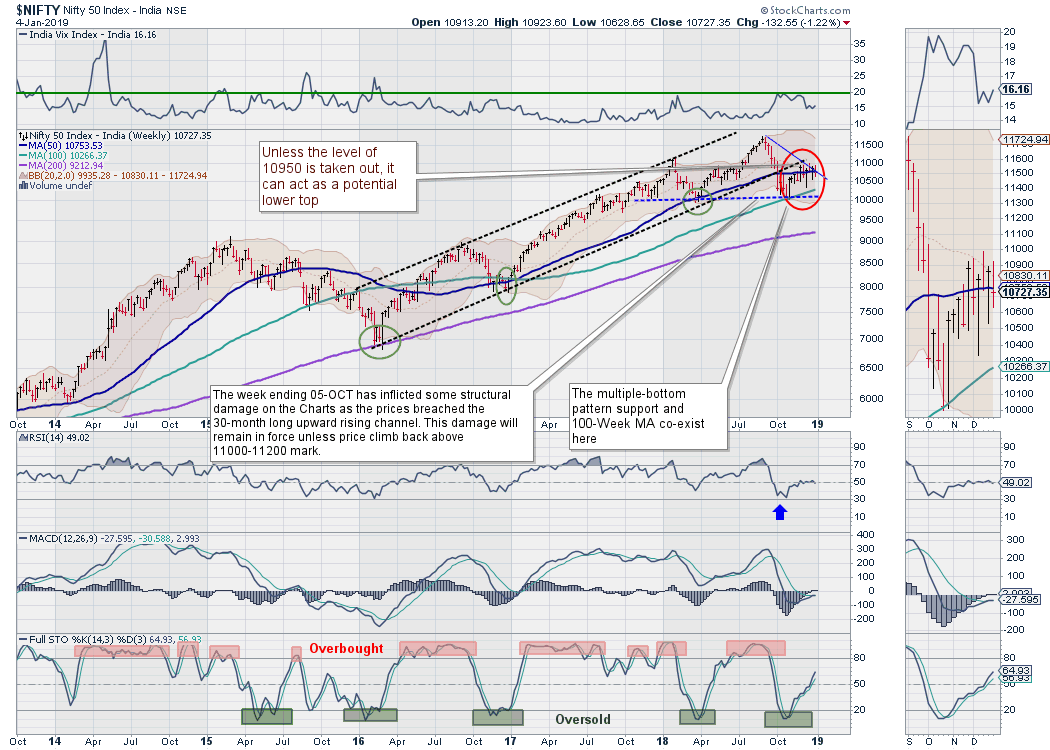
Despite the amount of shorts that were seen being created in the system, the market still awaits any major up-move. Presently, the NIFTY has ended just below its 50-Week MA, which is 10753. This level coincides with the falling trend line pattern resistance as well. This trend line begins from the high of 11760 and joins the subsequent lower top.
A positive start to the week is expected; it would be important for the markets to move meaningfully above the 50-Week MA and the subsequent resistance areas present on the daily charts. As of now, NIFTY remains trapped in a narrow range; therefore, a sharp move on either side is likely.
The Relative Strength Index (RSI) on the weekly chart is 49.0187; it remains neutral and shows no divergence against the price. The weekly MACD remains bullish, continuing to trade above its signal line. An engulfing bullish candle has occurred, which, having occurred during a downtrend, signals a potential bullish reversal. However, it will require confirmation on the next trading bar.
Any meaningful up move will emerge only after the NIFTY moves past the 10900-10950 congestion zone; the previous week's low of 10628 remains a key support level for the markets.
All in all, though the markets continue to struggle to move past key resistance levels, we expect the coming week to see the NIFTY trading with positive bias. Any move below 10628 will indicate weakness. With this level of 10628 acting as a key support, NIFTY will continue to remain in a defined range, with the zone of 10900-10950 acting as resistance.
Despite struggling at the key resistance levels, NIFTY has added good amount of open interest during the previous week. Downsides, if there are any in the coming week, are expected to remain limited as the existing shorts are likely to lend support at lower levels. We recommend remaining very modest and keeping overall exposures controlled and limited. While preserving liquidity at lower levels, modest purchases may be made with each dip that the markets may offer. Shorts should be avoided as they may lead to short squeeze at lower levels, unless NIFTY breaches its key supports. Overall, a cautiously positive approach is advised for the coming week.
Sector Analysis for the Coming Week
In our look at Relative Rotation Graphs, we compared various sectors against the CNX500, which represents over 95% the free float market cap of all the stocks listed.
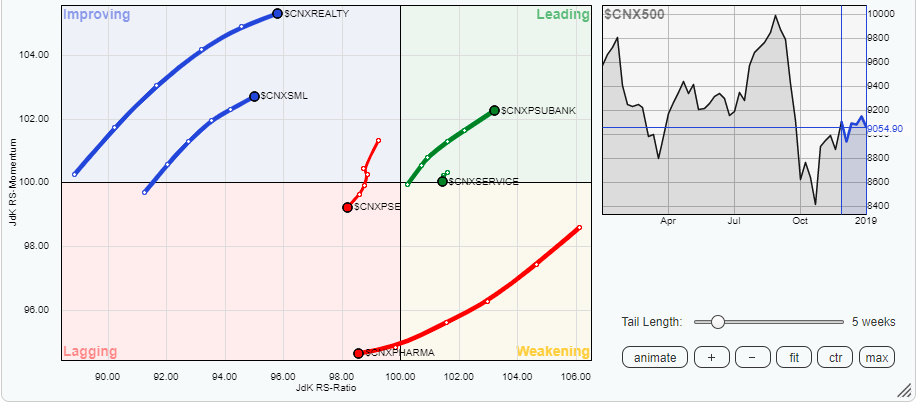
 Study of the Relative Rotation Graphs (RRG) shows that action is likely to remain limited only in select pockets in the coming week.
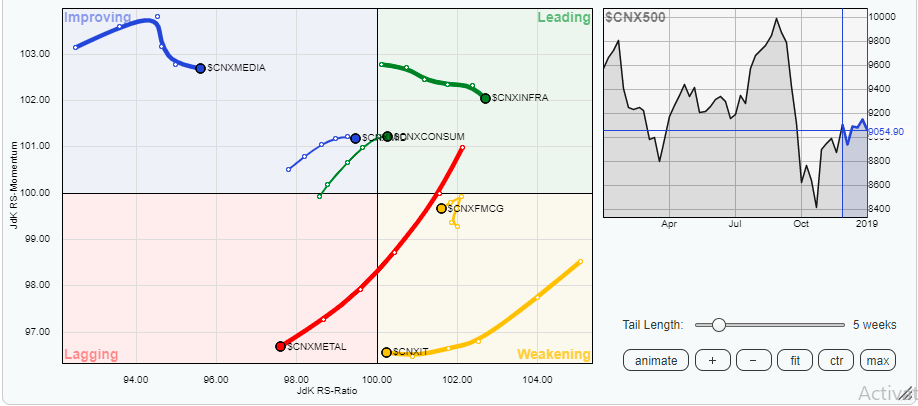
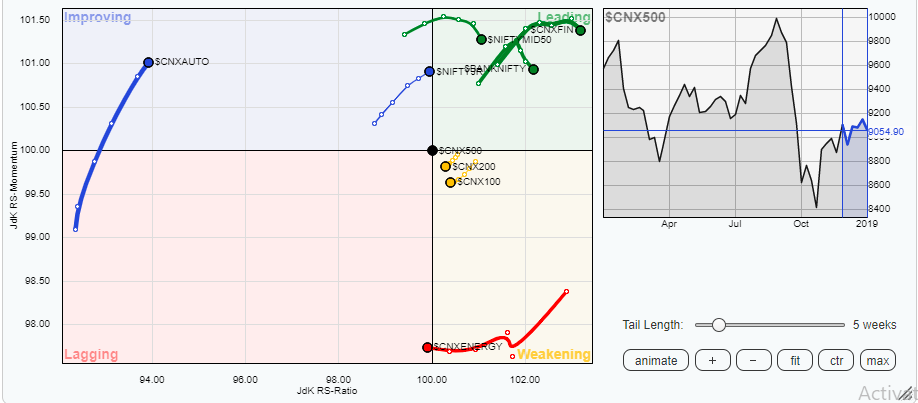
The Pharma Index, Infrastructure Index and BankNIFTY continue to remain in the leading quadrant. However, they are seen taking a breather and consolidating while getting stalled on the momentum front. PSUBanks, NIFTY Consumption Index, Financial Services and the Midcap Index also remain in the leading quadrant and are seemingly keeping their momentum intact.
The Realty and Auto index also remain firmly in the improving quadrant and can be seen maintaining their momentum. NIFTY Junior (NIFTY Next 50) is moving toward entering the leading quadrant.
The FMCG Index has suddenly retraced and, along with the broader CNX100 and CNX200 indexes, is seen losing steam. The Energy index, along with the Pharma and Metal Indexes, has crawled in the lagging quadrant but has flattened its trajectory. These pockets are likely to witness isolated stock-specific performance.
Important Note: RRG™ charts show you the relative strength and momentum for a group of stocks. In the above chart, they show relative performance as against the NIFTY500 Index (Broader Markets) and should not be used directly as buy or sell signals.
Milan Vaishnav, CMT, MSTA
Consulting Technical Analyst
www.EquityResearch.asia
