Bharat Petroleum Ltd. (BPCL.IN)
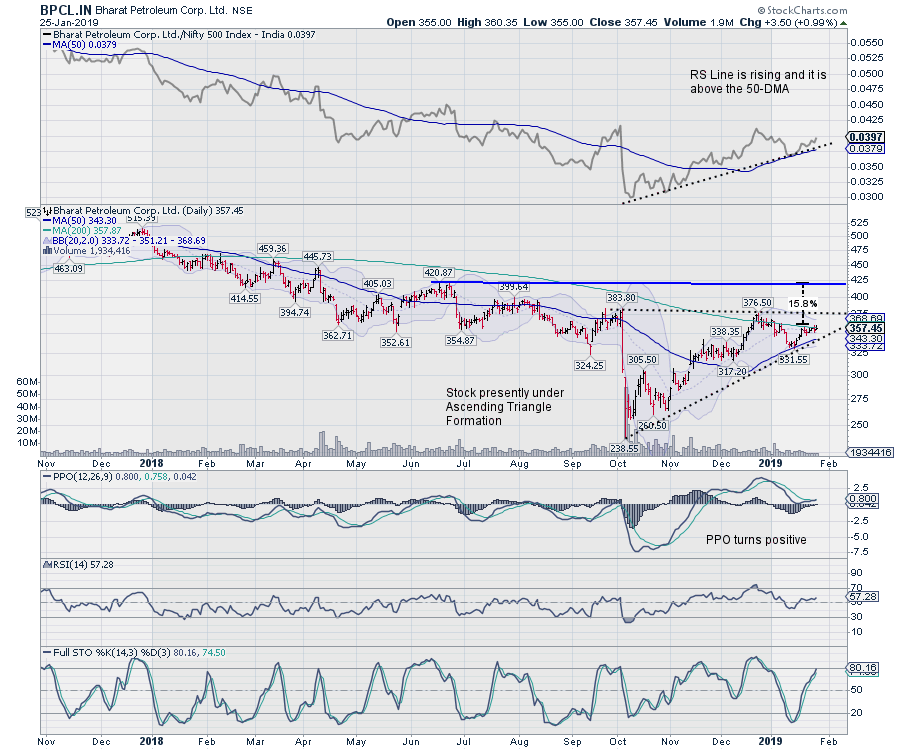
- Having formed a bottom at 238.55 following a steep fall from 383.80, the stock has since formed gradual higher bottoms. Presently it remains in an Ascending Triangle pattern, which is a bullish formation.
- The RS Line, when compared against broader CNX500 is rising; it is above 50-DMA and this acts as an confirmation.
- The PPO has turned positive. The daily MACD has shown positive crossover and is now bullish while trading above its signal line. On the weekly charts, MACD remains in continuing buy mode.
- The price on both the daily and weekly charts is seen consolidating near its 200-period MA. If prices move past these levels, that could infuse fresh momentum in the stock.
- Presently, the Bollinger bands are 43.66% narrower than normal. The short width of the bands suggests low volatility as compared to BPCL.IN's normal range. Therefore, the probability of volatility increasing with a sharp price move in the short term has increased. The probability of a significant price move increases with the length the bands remain in this narrow range.
- The stock remains in the leading quadrant of its RRG chart when bench-marked against the CNXEnergy index. CNXEnergy index can be seen sharply improving its relative momentum against the broader CNX500 index.
- If the present pattern is resolved on expected lines, the stock will return ~15% from its present level of 357.45. Any move below 330 will be negative for the stock.
Kaveri Seed Company Ltd. (KSCL.IN)
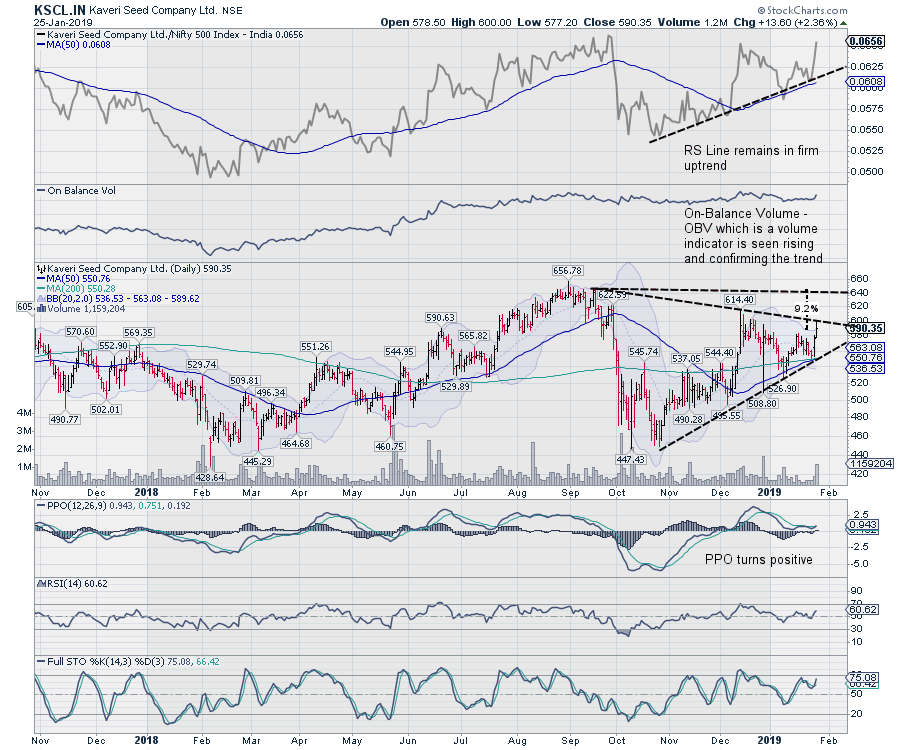
- Following a corrective decline from the 656 level, the stock formed a bottom in the 447-455 range. The subsequent price action over the past couple of months has resulted in the formation of a symmetrical triangle.
- A couple of signals have emerged that point toward a likely upward price revision. The daily MACD has shown a positive crossover; it is now bullish and trades above its signal line. PPO has turned positive.
- RSI has marked a fresh 14-period high, which is bullish.
- The RS Line against the broader markets remains in a firm uptrend and is above its 50-DMA.
- The stock price is above all the Moving Averages (50, 100 and 200), which remain very close to each other between 550 and 553. The 50DMA can be seen cutting across the larger averages from below.
- The prices have closed above the upper Bollinger band. Some short term contraction of price inside the band is possible, but prices have broken the upper band and an upside breakout is possible.
- If the present formation results in the up move on expected lines, the stock could return ~9% from the present level of 590.35. Any move below 550 will be negative for the stock.
Milan Vaishnav, CMT, MSTA
Consulting Technical Analyst
www.EquityResearch.asia
Disclosure pursuant to Clause 19 of SEBI (Research Analysts) Regulations 2014: Analyst, Family Members or his Associates holds no financial interest below 1% or higher than 1% and has not received any compensation from the Companies discussed.

About the author:
Milan Vaishnav, CMT, MSTA is a capital market professional with experience spanning close to two decades. His area of expertise includes consulting in Portfolio/Funds Management and Advisory Services. Milan is the founder of ChartWizard FZE (UAE) and Gemstone Equity Research & Advisory Services. As a Consulting Technical Research Analyst and with his experience in the Indian Capital Markets of over 15 years, he has been delivering premium India-focused Independent Technical Research to the Clients. He presently contributes on a daily basis to ET Markets and The Economic Times of India. He also authors one of the India's most accurate "Daily / Weekly Market Outlook" -- A Daily / Weekly Newsletter, currently in its 18th year of publication.
Learn More