With the last day of the trading week remaining a drag, the NIFTY returned all its weekly gains and ended on a negative note. If we look at the daily charts, we can see the NIFTY achieved a breakout by moving past the 10950 level, but had returned all those gains again by end of the week. The headline index went nowhere and ended the week with a net loss of 125.80 points (-1.14%) on a week-to-week basis.
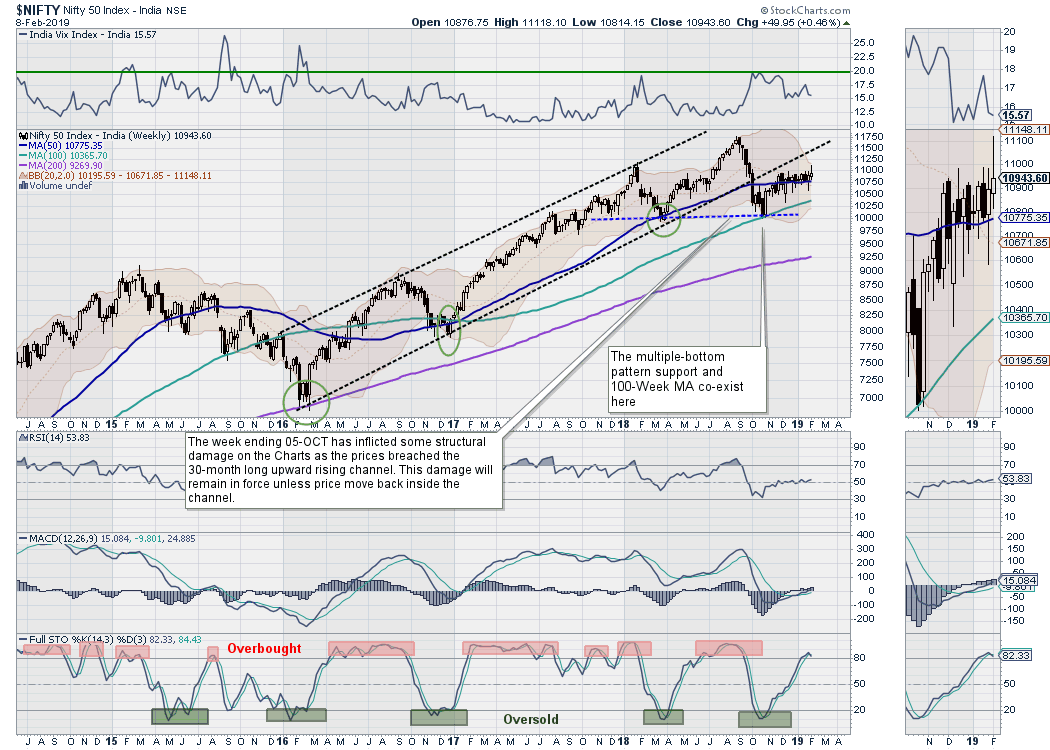
On the weekly charts, the index has continued to remain above the 50-Week MA, which is 10775 at present. For the 12th week in a row, the NIFTY has not meaningfully moved past this level, despite managing to keep its head above it.
We're expecting a tepid start to the coming week, with the possibility that the markets will be put into some consolidation again. The major culprit this week was the Market Breadth Index, which remained weak and contributed to an extension of the severe throwback the market has suffered after moving past 10950. We had expressed apprehension about the weaker and inadequate market breadth in one of our special notes here.
The coming week will face resistance at 11100 and 10195, while downsides, if any, will find important support at 10775, the 50-Week moving average. Another support level exists at the 10700 mark.
The weekly RSI is 53.8303; it has marked its fresh 14-period high which is bullish. No divergence is observed against the price. The weekly MACD stays bullish and trades above its signal line. No significant formations were observed on candles.
From the pattern analysis, it can be observed that, after finding its base just below the 10000 level, the index has pulled back and marked higher bottoms. However, it has narrowed range of late and has been moving sideways, just above its 50-Week moving average.
In the coming week, the 10950 level will remain important in many ways. If the throwback persists, then it would be an acceptable technical situation. In this case, the index will consolidate in a defined range, but will stay just above or below the 10950 mark. However, if a major slip below this mark occurs, then the breakout on the daily chart would fail. In this situation, it would be critically important for the NIFTY to hold the important support level of the 50-Week moving average on a closing basis.
We recommend avoiding major shorts as the structure of the markets remain intact. However, until this consolidation, inflicted upon the markets by continued weak market breadth, is over, we recommend remaining highly stock-specific in making fresh purchases, guarding profits vigilantly at higher levels and keeping overall exposures modest.
Sector Analysis for the Coming Week
In our look at Relative Rotation Graphs, we compared various sectors against the CNX500, which represents over 95% of the free float market cap of all the stocks listed.
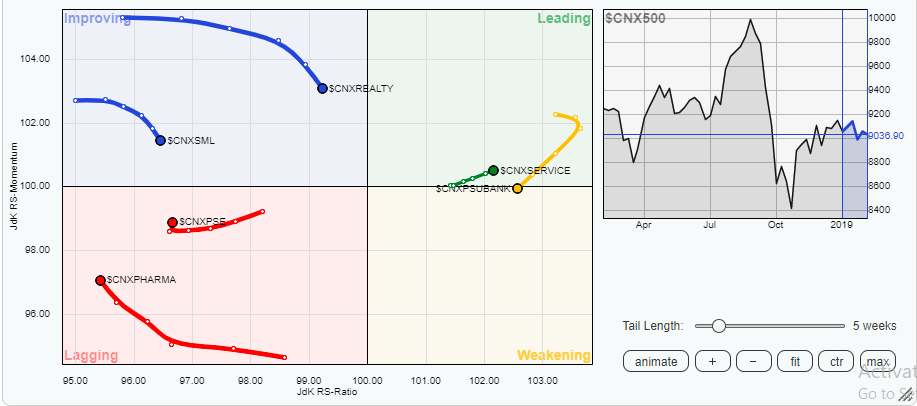
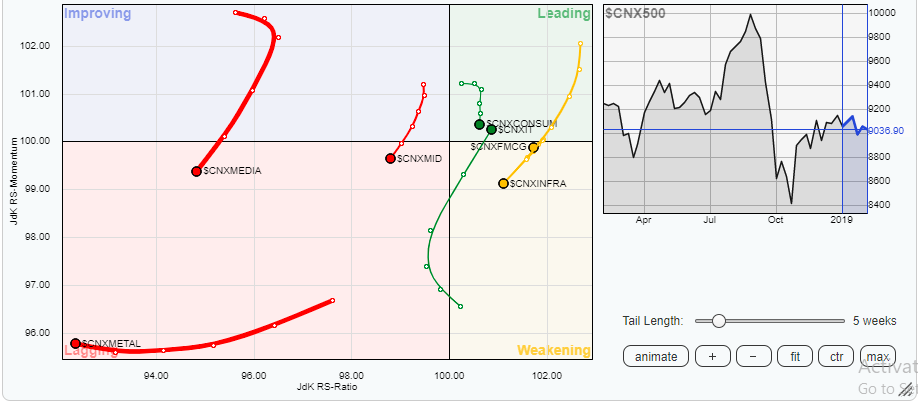
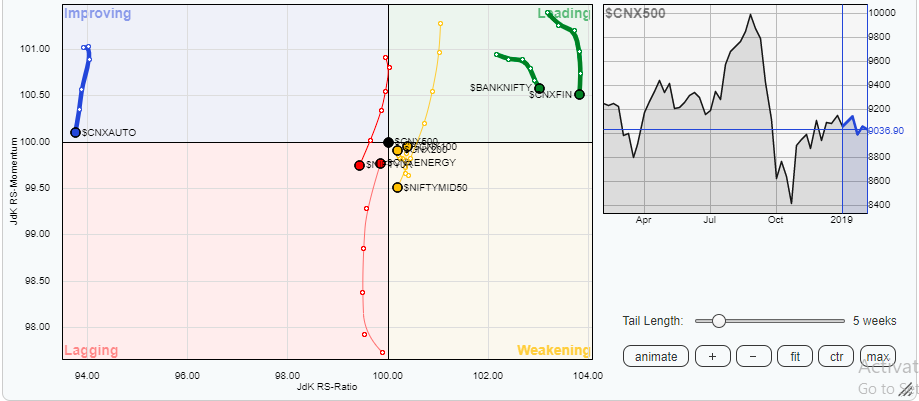 In analyzing the Relative Rotation Graph (RRG) above, it can be seen that CNXEnergy has continued to sharply improve its relative momentum against the broader markets. Additionally, the CNX IT index has also crawled back into the leading quadrant. These two groups, along with the Services sector index, are likely to relatively out-perform the broader markets. The BankNifty and Financial Services indexes, along with the Consumption pack, remain in the leading quadrant, but are seen faltering on the relative momentum front. They may not grossly under-perform but may remain in a broad range.
The Auto, Infra, FMCG, Media and Midcap packs are seen drifting lower and losing their relative momentum. Some under-performance is expected from these packs.
On the other, good improvement can be observed in the Pharma index, even as it remains in a lagging quadrant. Some strong stock-specific performances may come out of this group.
Important Note: RRG™ charts show you the relative strength and momentum for a group of stocks. In the above chart, they show relative performance as against the NIFTY500 Index (Broader Markets) and should not be used directly as buy or sell signals.
Milan Vaishnav, CMT, MSTA
Consulting Technical Analyst
www.EquityResearch.asia
