Over the past week, the market performed in striking contrast to what had been expected. For nearly 15 weeks, the markets were consolidating near their 50-Week MA and, last week, were showing signs of further impending consolidation. In spite of this, the markets ended up putting up a very strong show last week; the headline index piled up strong gains, ending the week with net gain of 391 points (+3.55%) on a weekly basis.
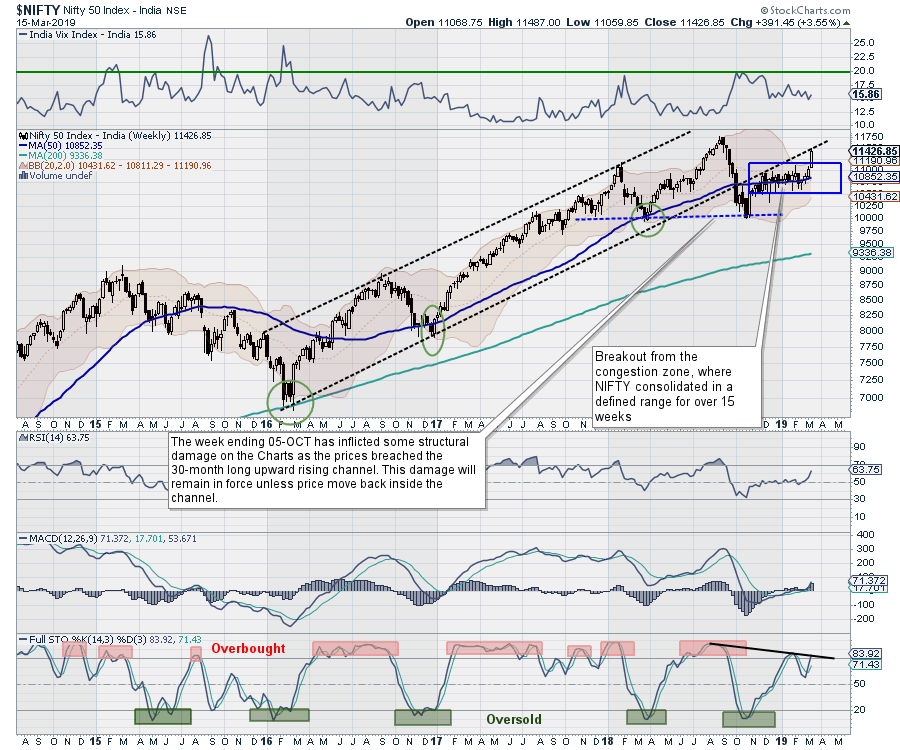
Without disputing the strong momentum, this is the time when both traders and investors alike need to put prudence before greed. NIFTY has ended near some very important pattern resistance points on the weekly chart, while, on the daily chart, it remains steeply overbought and evidently prone to consolidation.
By the time the session on Friday ended, the NIFTY had come off nearly 60 points from the high point of the day, displaying some signs of taking a breather. Though we expect a stable start to the coming week, the behavior of the NIFTY against the levels of 11500 will be important to watch. We do not expect the NIFTY to post any significant runaway rise beyond this point.
We have a 4-day trading week as Thursday, March 21 is a trading holiday on account of Holi. We expect the levels of 11500 and 11625 to act as immediate resistance points for the markets. Supports will come in much lower, at the 11210 and 10950 levels.
The weekly RSI is 63.7457; RSI has marked a fresh 14-period high, which is bullish, and does not show any divergence against the price. The weekly MACD continues to trade above its signal line. A big white candle has emerged following a congestion zone and, in the process, has lent credibility to the up move.
The pattern analysis of the weekly chart presents an interesting picture. On one hand, the current up-move, which is being chased by a gush of liquidity, shows strong momentum in place. On the other hand, the NIFTY has halted just below the lower trend line of the 30-month-long upward rising channel, which it breached on the downside in the first week of October 2018. This level, which was a support earlier, may pose some resistance to the markets at higher levels, even if it is for a short-term.
The NIFTY has closed above the upper Bollinger band. Though the prices have broken the upper band, the most likely scenario is for the current range to continue. Usually, if supported by other pieces of evidence present on the chart, any close above the upper Bollinger band may signal a fresh breakout. However, in the present context, the chances of the NIFTY getting pulled back inside the band are much higher. The index remains grossly overbought on the daily chart and any unabated rise, despite the liquidity chasing the markets, will be unhealthy if it comes without any consolidation, which looms imminent.
All in all, we reiterate once again that, for the immediate short term, it is now extremely important to place prudence before greed. The over-heated parameters on the daily charts are enough to suggest that the markets may slip into consolidation at any time; such moves could remain violent and equally sharp on the downside. Even if the downside may remain limited, they will bring considerable volatility in the trade. We strongly suggest continuing to remain extremely light on exposures and utilizing up moves to protect profits at higher levels. Greedy momentum chasing should be avoided and we encourage adopting a highly cautious view for the coming week.
Sector Analysis for the coming week
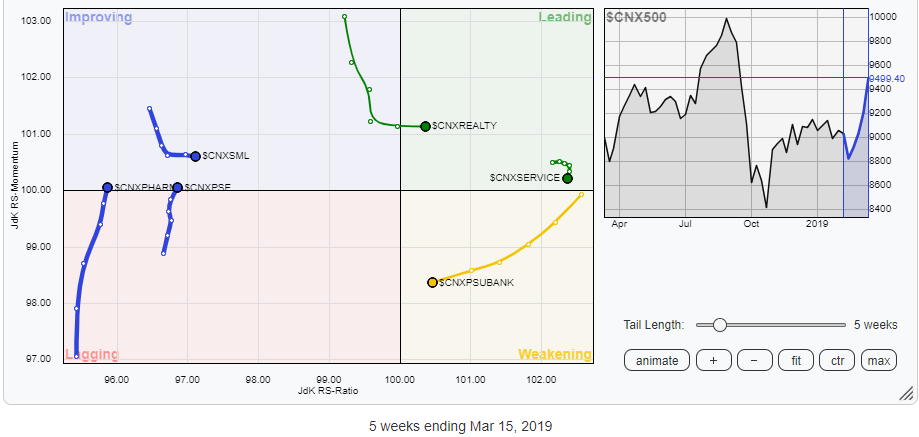
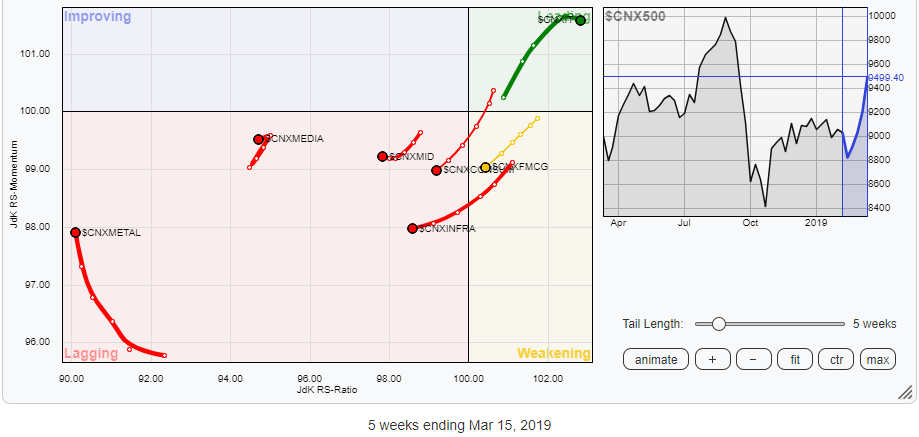
In our look at Relative Rotation Graphs, we compared various sectors against CNX500, which represents over 95% of the free float market cap of all the stocks listed.
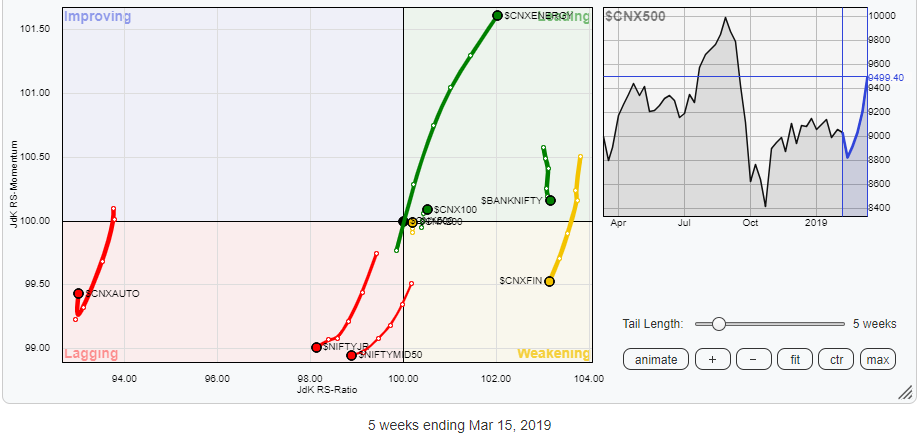 While reviewing Relative Rotation Graphs (RRG), we can see that the BANKNIFTY has halted its decline and loss of momentum, given the very strong weekly performance of this week. It remains in the leading quadrant, as do the ENERGY, IT, CNX 100 and Services sector. Out of these, ENERGY and IT continue to remain favorably placed. The CNX REALTY index has also crawled into the leading quadrant. These groups are collectively likely to post good relative out-performance in the coming week.
The MEDIA, FMCG, Infrastructure, NIFTY MID50 and NIFTY Next 50, along with Auto, remain in the lagging quadrant. The PSUBank index also remains in the weakening quadrant. This shows that the rally that we witnessed in this week came courtesy of just select sections of the markets.
Meanwhile, the PHARMA, Metals and CPSE indexes have continued to show improvement in their relative momentum. These groups may post stock-specific out-performances in the coming week.
Important Note: RRG™ charts show you the relative strength and momentum for a group of stocks. In the above chart, they show relative performance as against the NIFTY500 Index (Broader Markets) and should not be used directly as buy or sell signals.
Milan Vaishnav, CMT, MSTA
Consulting Technical Analyst
www.EquityResearch.asia
