The past week remained as flat as it can get. In our previous weekly note, we had expected the week to remain volatile and the level of 11760 continuing to pose stiff resistance to any up-moves. Hewing very close to expected lines, the Indian equity markets remained volatile, headed nowhere, continued to resist to the 11760 level and, finally, ended flat with meager gain of 1.85 points (+0.02%) on a weekly basis.
 We again face a truncated and short 3-day working week. There are two trading holidays; Monday on account of General Elections Voting in Mumbai and Wednesday because of Maharashtra Day. We expect this coming week to largely remain volatile and uneventful as well. With the NIFTY ending very close to the key level of 11760, the behavior of the markets vis-à-vis the level of 11760 will remain the focus of attention.
We may see attempts by NIFTY to move higher and its struggle with not-so-favorable short-term technical setup. The coming week will see the levels of 11760 and 11890 acting as immediate resistance points. Supports come in much lower, at 11650 and 11550.
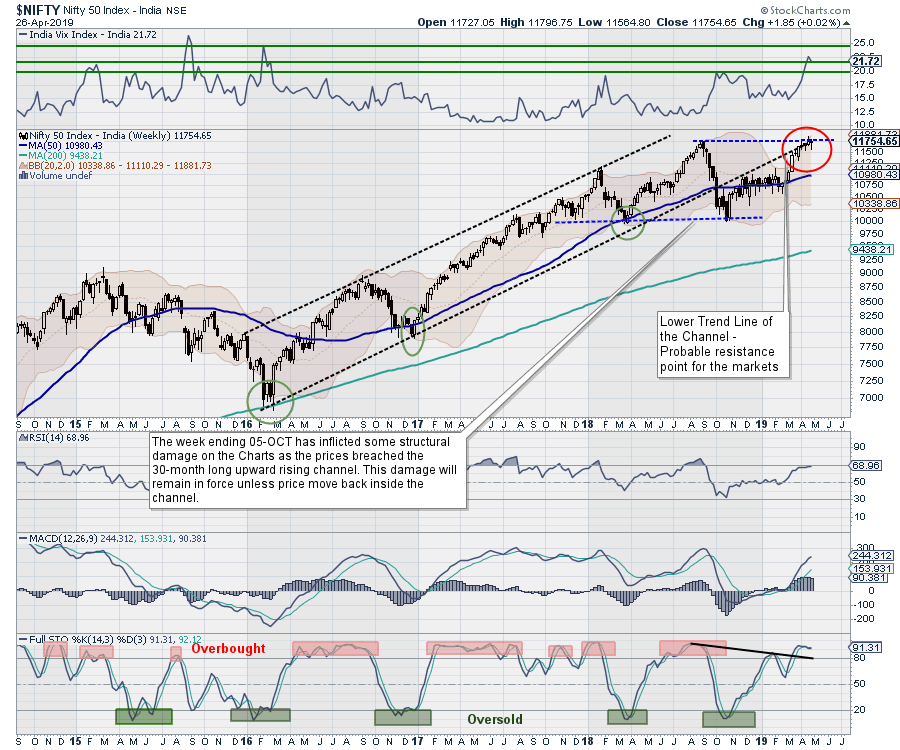
The Relative Strength Index (RSI) on the weekly chart is 68.9554. The weekly MACD remains bullish as it trades above its signal line. A Long Lower Shadow occurred on candles. This formation usually has bullish implications, but only if it occurs during a downtrend or after some corrective move. In the present context, it is not of any significance. The small real body of the candle formed a Spinning Top, which often depicts indecisive behavior of market participants and shows potential loss of momentum.
The NIFTY is presently resisting the lower trend line of the upward rising channel that it breached on the downside in October 2018. Given the rising nature of this trend line, the NIFTY has been marking incremental highs, but it is failing to give a clear and clean breakout. In the coming week, we reiterate our word of caution as, even if NIFTY marks some incremental higher levels, it may still not give a sustainable and strong breakout. We strongly suggest using up-moves, if there are any, to reduce exposures and protect profits at higher levels. You may want to avoid aggressive buying; if not, it should still be kept highly selective and in modest quantities.
Sector Analysis for the Coming Week
In our look at Relative Rotation Graphs, we compared various sectors against CNX500, which represents over 95% of the free float market cap of all the stocks listed.
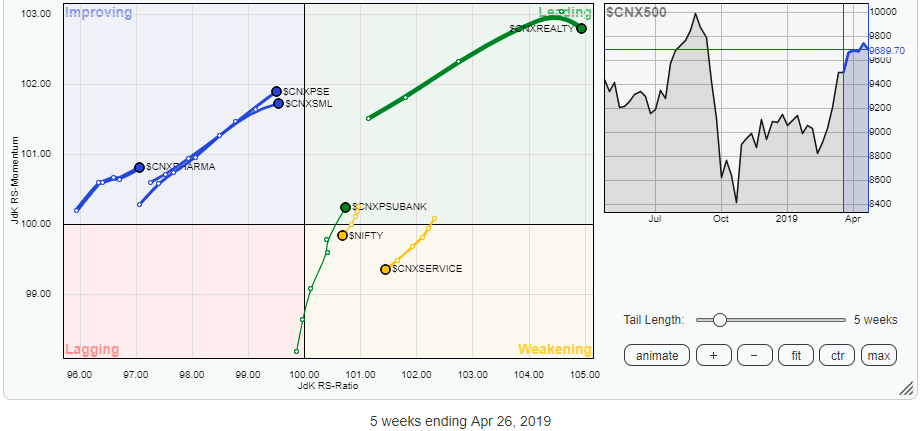
 The review of Relative Rotation Graphs (RRG) paints a mixed picture. The Realty sector remains firmly placed in the leading quadrant, though it is it seen consolidating at current levels. Meanwhile, the Energy pack, though still in the leading quadrant, is seen sharply losing its momentum. During the previous week, it seemed to be taking something of a breather. Additionally, the PSU Bank Index has crawled back into the leading quadrant. These three groups are likely to offer resilient performance in the coming weeks.
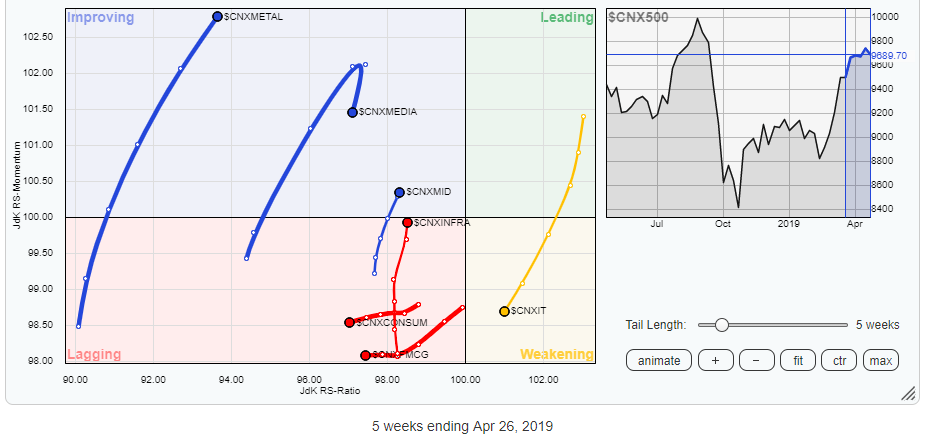
Apart from this, the Media pack has taken a U-turn and has shown sharp loss of momentum, despite remaining in the improving quadrant. The Metal, CPSE and Pharma Indexes are seen keeping their relative momentum intact while being placed in the improving quadrant. The Infrastructure index, too, is seen improving its relative momentum against the broader CNX500, though it remains in the lagging quadrant as of now.
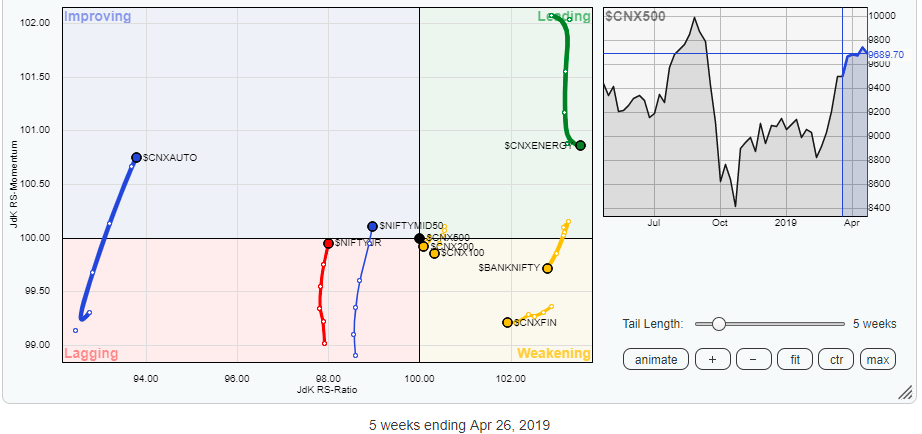
The IT Index, Services Sector, FMCG, Consumption, Financial Services and BankNIFTY packs are seen gradually losing momentum against the broader CNX500 index. Barring some stock-specific out-performances, these groups may not offer any collective significant outperformance against the broader markets.
Important Note: RRG™ charts show you the relative strength and momentum for a group of stocks. In the above chart, they show relative performance as against the NIFTY500 Index (Broader Markets) and should not be used directly as buy or sell signals.
Milan Vaishnav, CMT, MSTA
Consulting Technical Analyst
www.EquityResearch.asia
