 The reality is that markets operate within the law of groupings. This is precisely why I have formatted my unique chart view in a pull-down menu under ChartStyles. You simply click on “Gatis Roze” at the bottom of “Predefined Settings” and up pops the Tensile Trading analysis format that clearly shows the following:
A) How your stock is performing relative to the market.
B) How the Sector for your stock is performing relative to the market.
C) How your stock’s Industry Group is performing relative to its Sector.
D) How your stock is performing relative to its own Industry Group.
If we look at Silicon Labs (SLAB) from the Action Practice #19 blog and apply this format, we can easily see the power of the Tensile Trading visual presentation.
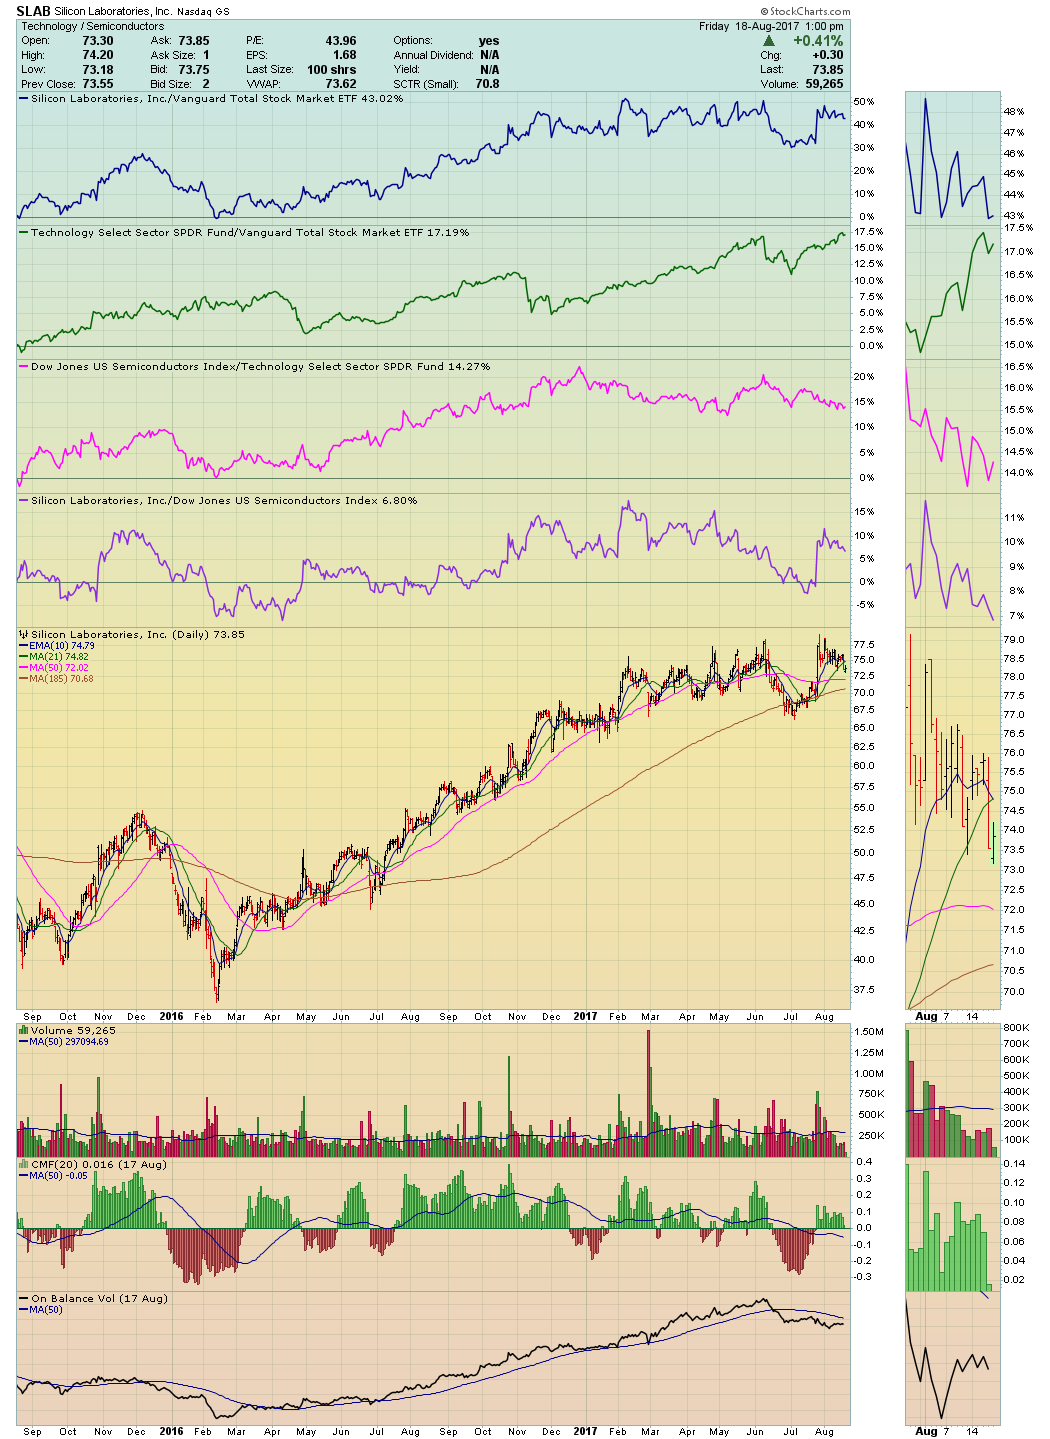 Remember: our objective is to build a ChartList populated with the most appropriate charts (as if we have actually purchased SLAB) and must now monitor it closely. Note as well that this chart illustrates money flow in the bottom two charts.
The second ChartList entry would be simply an individual chart of the Technology Sector SPDR (XLK) enabling me to understand what is specifically happening in the Sector to which Silicon Labs belongs. Another ChartList entry would be the Dow Jones US Semiconductor Industry Group ($DJUSSC). This, however, is not a tradeable ticker. Therefore, I also want to add an appropriate industry-specific ETF which trades.
In choosing which Industry ETF to use, I like to utilize the free website ETF.com which is rich in data and helpful for finding competitive alternatives to most ETFs. In the case of SLAB, it comes down to iShares PHLX Semiconductor ETF (SOXX) versus VanEck Vectors Semiconductor ETF (SMH). My preference is SOXX for these five reasons:
- It caps individual security weights at 8%.
- It has outperformed SMH over the past 5 years.
- It includes companies not based in the USA but listed here.
- It has a slightly higher yield.
- In assets under management, both ETFs are very similar.
In addition to the Industry ETF — SOXX — I also install the the semiconductor index ($SOX) which again is a non-tradeable index.
So now I feel confident that I can keep my eye on the semiconductor industry group of which Silicon Labs is a member. Once I’ve covered the Sector and Industry specific charts, I move on to the Sister Stocks.
Choosing Sister Stocks:
I use a three-prong approach. Both NASDAQ.com and investors.com generate a list of competitors. For SLAB, I am looking for companies roughly the same size and in the same business. Intel is included only because it is such a Semiconductor bell-weather stock. I then install all the candidates on one or more PerfCharts, looking for those equities which historically have been highly correlated in price action to SLAB. This is done on the assumption that if the correlation becomes uncoupled, then my radar should pick this up and start asking why. In essence,it’s an early warning sign. For SLAB, I choose AVGO, MPWR, ASX, TER and INTC as sister stocks.
Once the sisters are chosen, I populate the ChartList with a PerfChart that loads SLAB alongside its sisters and includes the Sector ticker and the Industry ticker. Finally, I add each of the sister stocks individually to the ChartList so I can visually inspect their separate charts for price action, trends, money flow and momentum.
Back to Action Practice #19. The ChartList for Abbott Labs (ABT) would be constructed in the same manner with the appropriate Sector (XLV), Industry Group ($DJUSPR) and tradeable Industry ETFs (PJP & PPH). The sister stocks for Abbott would be other similar blue-chip pharmaceuticals, such as Johnson & Johnson, Bristol Myers, Merck, GlaxoSmithKline and Pfizer.
The overriding objective of constructing a ChartList to support the equity you purchased is to acknowledge the “Law of Groupings”. Stock price movements are determined by the company they keep. Sectors, Industry Groups and Sister Stocks all provide many clues for properly monitoring your position and selling in a timely fashion. Trust me — your efforts will be rewarded in the timeliness of your insights.
This Week’s Action Practice:
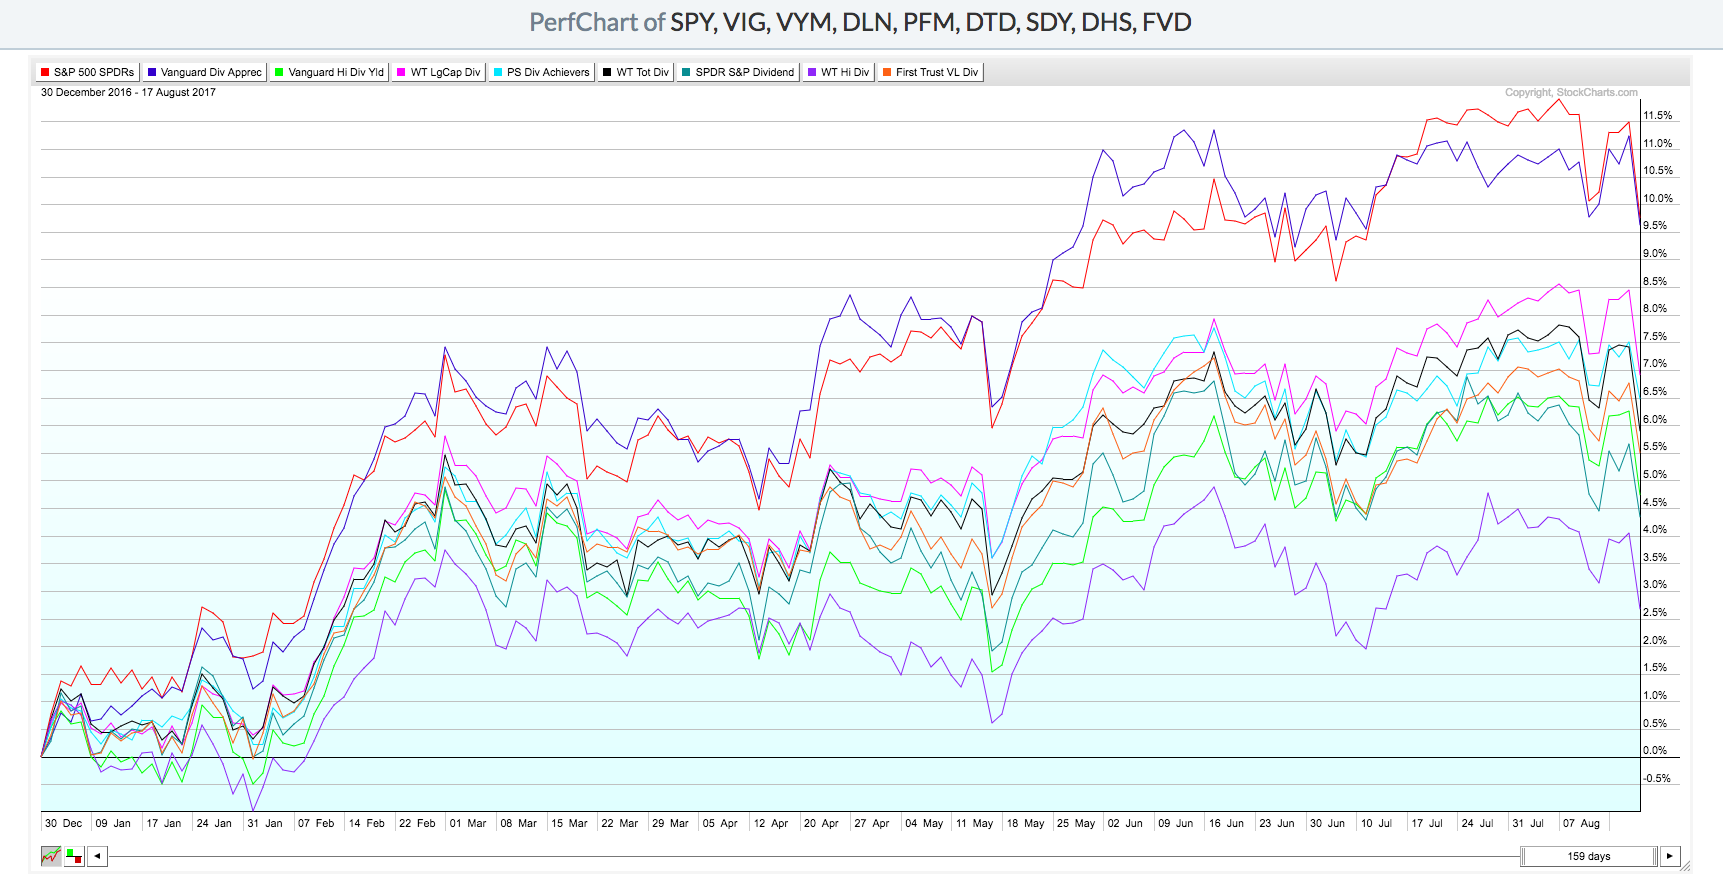
The first waves of baby boomers (of which I am a proud member) have entered retirement. As such, the demand for sources of investment income is a significant driver in their asset allocation decisions. Countless numbers of these investors are looking to ETFs (rightfully so), but too many are chasing yield and don’t realize the dangers of such a singular strategy.
The exercise is to compare and contrast these nine income-oriented ETFs and to understand explicitly what you are buying.
 HINTS:
- Expense ratios range from 0.08% to 0.70%. Costs matter.
- 12-month yields range from 1.87% to 3.13% (and can be very volatile over time).
- All of these ETFs have at least 10 years of trading history. Performance over these past ten years ranges from +70% to +140%.
- Consider individual stock holdings and then dividend sustainability. In other words, are the equities blue-chip stocks or are they smaller companies with a narrow economic moat?
- How have these candidates done in bear markets?
Remember: blue-chip firms won’t commit to high dividend payouts unless management is confident that they can deliver through a complete business cycle. It’s a well-known fact that the market severely punishes firms that cut their dividends. Just look at what happened to Bank of America (BAC) in 2008 or ConocoPhillips (COP) in 2016 when they cut their dividends. Good luck in picking the income oriented ETF that best suits your individual risk tolerance and financial requirements.
Trade well; trade with discipline!
- Gatis Roze, MBA, CMT
- Grayson Roze
- Author, Tensile Trading: The 10 Essential Stages of Stock Market Mastery (Wiley, 2016)
- Presenter of the best-selling Tensile Trading DVD seminar
- Presenter of the How to Master Your Asset Allocation Profile DVD seminar
- Developer of the StockCharts.com Tensile Trading ChartPack
