|
|
The short answer is yes. More importantly, this indicator is available in SharpCharts as the Money Flow Index (MFI). Developed by Gene Quong and Avrum Soudack, the Money Flow Index measures buying and selling pressure with calculations based on the RSI formula. They refer to their Money Flow Index (MFI) as volume-weighted RSI in an article with Stocks & Commodities Magazine. John Bollinger, a fan of the Money Flow Index, also mentioned this indicator in an interview with the same magazine. This article will not delve into the formula specifics. There is a Money Flow Index (MFI) article in our chart school that covers the details.

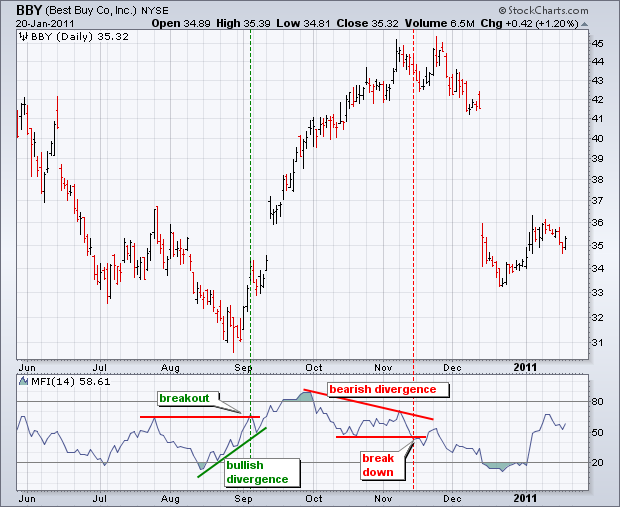
By incorporating volume, the Money Flow Index can be a valuable tool for the chartist. Bullish divergences and breakouts can be used to identify bottoms. Conversely, bearish divergence and break downs can be used to anticipate tops. The chart for Best Buy (BBY) shows an example of each. As with all indicators, the Money Flow Index (MFI) should not be used alone. Chartists should incorporate other aspects of technical analysis, such as a classic momentum oscillator or pattern analysis. More examples of the Money Flow Index can be found in the ChartSchool article.


