|
|
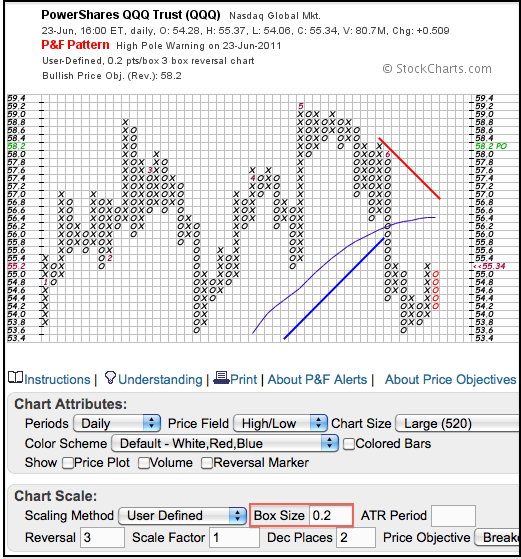
Stockcharts.com users can add four different chart overlays to their P&F charts. Using the Graphical P&F chart, which is the default, simply scroll to “Chart Overlays” section just below actual chart. Users can add up to three indicators (Trendlines, Bollinger Bands, Simple Moving Average and Price-by-Volume).

Keep in mind that P&F indicators are calculated a little differently. For example, a 10 period simple moving average would be based on the average column length for the last 10 columns. Instead of a daily or weekly close, the mid point of each column is used to calculate the moving average.

Click this image for a live chart.
The chart above shows the Nasdaq 100 ETF (QQQ) based on 20 cents per box with a 50 period simple moving average. Notice that the ETF broke the moving average and the trendline with the June decline. The new red trendline and moving average now become the first resistance levels to watch.


