MailBag July 29, 2011 at 09:40 AM
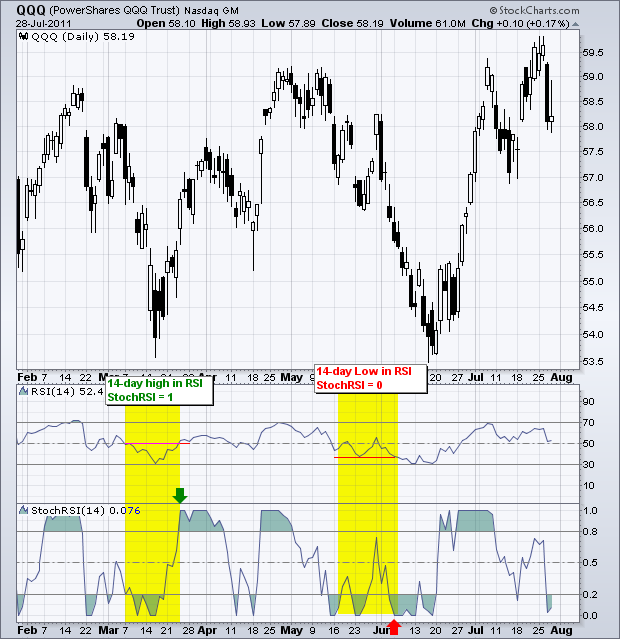
StochRSI is volatile because it is an indicator of an indicator. Most indicators are derived directly from price. StochRSI is derived directly from RSI values, which are derived from price. This means StochRSI is two steps removed from the actual price. This is also known as the second derivative. Using the Nasdaq 100 ETF (QQQ) as an example, 14-day StochRSI would be 14-day Slow Stochastics applied to 14-day RSI for QQQ. Developed by Tushard Chande and Stanley Kroll, StochRSI was designed to increase sensitivity and signals from RSI. And it does. The chart above shows RSI fluctuating Read More
MailBag July 22, 2011 at 10:28 AM
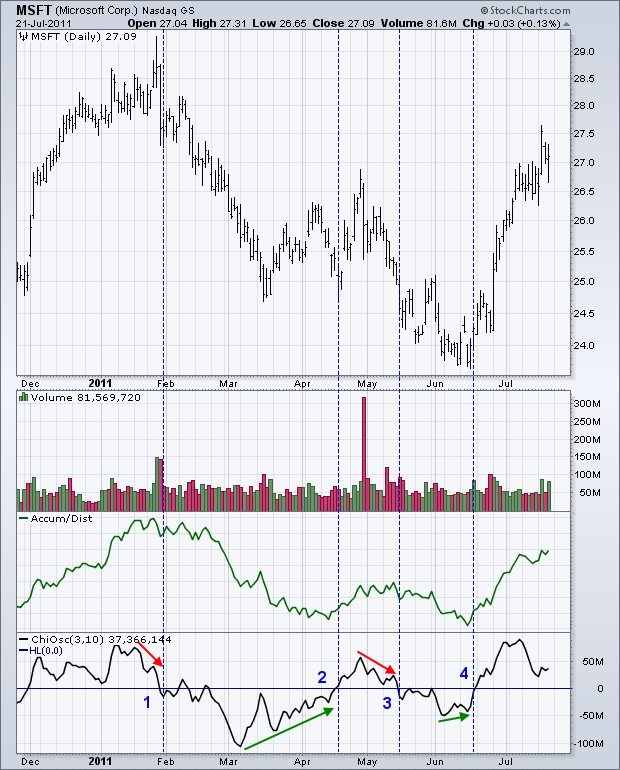
Invented by Marc Chaikin, the Chaikin Oscillator is an indicator of an indicator. In particular, it measures the momentum of the Accumulation Distribution Line, which is also a Chaikin indicator. The Chaikin Oscillator (3,10) shows the difference between the 3-day EMA of the Accumulation Distribution Line and the 10-day EMA of the Accumulation Distribution Line. The Chaikin Oscillator is positive when the 3-day EMA is above the 10-day EMA and negative when the 3-day EMA is below the 10-day EMA. The chart above shows Microsoft (MSFT) with the Chaikin Oscillator and Accumulation Read More
MailBag July 15, 2011 at 03:50 PM
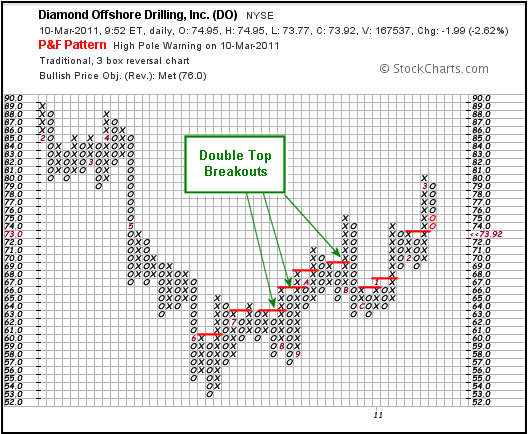
A bar chart Double Top is a bearish reversal pattern, while a P&F Double Top is a bullish breakout pattern. Attaching the word “breakout” to the P&F version helps reduce confusion. A Double Top Breakout is the most common bullish pattern in the P&F world. Its counter part, the Double Bottom Breakdown is the most common bearish pattern. P&F charts are drawn with rising X-Columns and falling O-Columns. An X-Column that exceeds a prior X-Column triggers a Double Top Breakout. The example below shows Diamond Offshore (DO) with several Double Top Breakouts. The Double Top on a Read More
MailBag July 09, 2011 at 02:32 PM
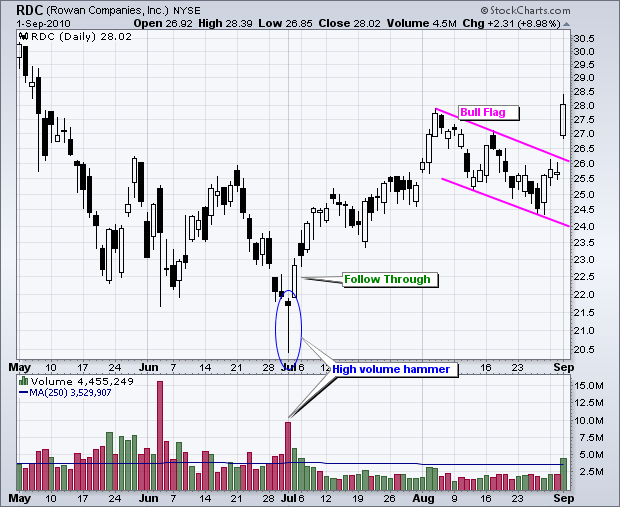
A Selling Climax is a high volume decline that is suddenly reversed. Candlesticks are especially helpful for identifying a selling climax. In particular, chartists should be on the look out for high volume Hammers, Bullish Engulfing patterns and Piercing Lines. Before looking for such patterns, remember that the security should be in a clear downtrend with the current move being down, usually sharply down. A Hammer is a signal candlestick pattern with a long lower shadow and a small body near the top of the range. This patterns shows that sellers pushed the stock sharply lower during the Read More