|
|
A bar chart Double Top is a bearish reversal pattern, while a P&F Double Top is a bullish breakout pattern. Attaching the word “breakout” to the P&F version helps reduce confusion.
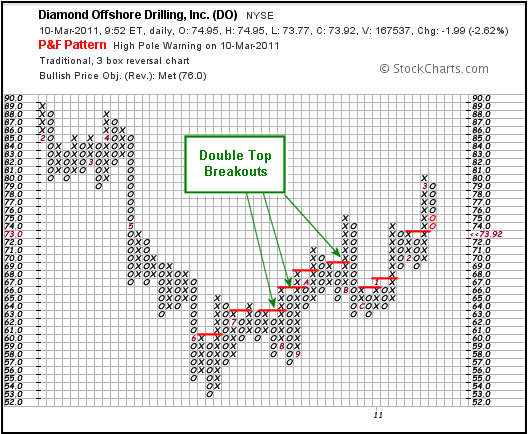
A Double Top Breakout is the most common bullish pattern in the P&F world. Its counter part, the Double Bottom Breakdown is the most common bearish pattern. P&F charts are drawn with rising X-Columns and falling O-Columns. An X-Column that exceeds a prior X-Column triggers a Double Top Breakout. The example below shows Diamond Offshore (DO) with several Double Top Breakouts.

Click this image for a live chart
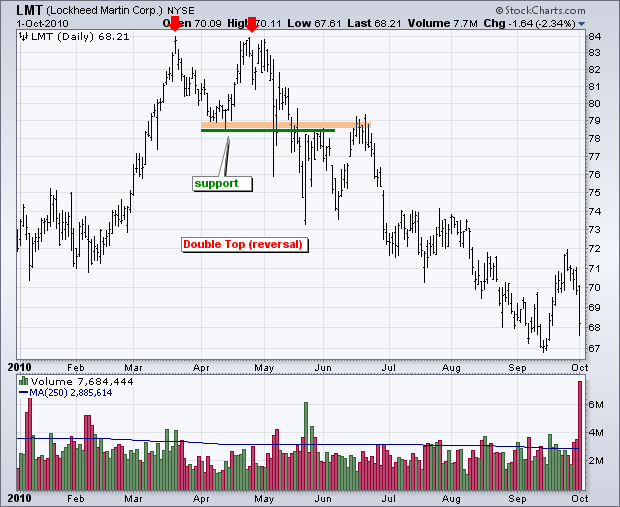
The Double Top on a bar chart is a bearish reversal pattern. Two relatively equal highs form to mark a clear resistance level within an uptrend. A reaction low forms between these two highs to mark support. Technically, the trend has not yet reversed and the Double Top is not confirmed until there is a clear support break. The chart below shows Lockheed Martin (LMT) with a potentially bearish Double Top reversal in March-May last year. The stock confirmed this pattern with a support break and broken support turned into resistance in June.

Click this image for a live chart
See our ChartSchool articles for more on P&F charting and bar chart patterns.


