|
|
The Force Index is a price-volume oscillator designed to measure the balance of power behind a particular move. The Force Index rises when the close is above the prior close and falls when the close is lower. This rise or fall is enhanced by the extent of the move and the volume behind it. A strong advance on big volume pushes the Force Index sharply higher, while a sharp decline on big volume pushes it lower.
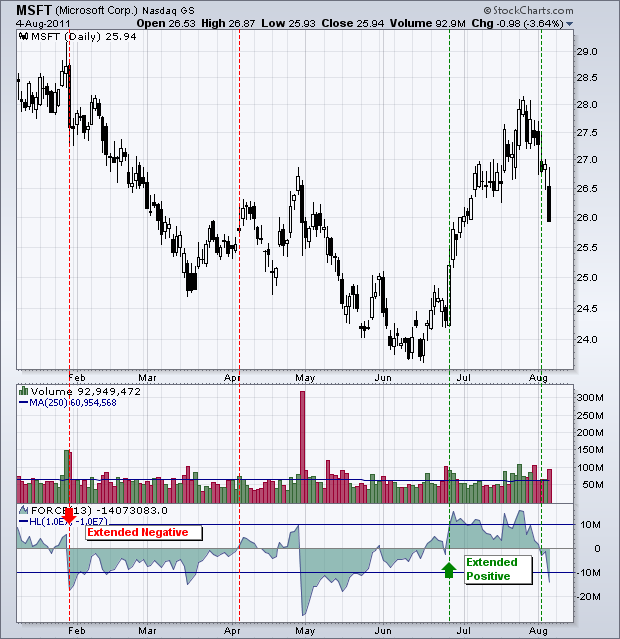
The Force Index oscillates above/below the zero line. At its most basic, readings above zero generally favor an uptrend, while readings below zero favor a downtrend. As the chart for Microsoft shows, the Force Index can remain negative or positive for extended periods.

There are, however, brief crosses of the zero line that can be insignificant. As a remedy, chartists can apply bullish and bearish thresholds to further filter signals (blue lines). For example, a surge above 10M could be considered strong enough to start an uptrend (green arrow). A plunge below -10M could be strong enough to start a downtrend (red arrow). Note that this filter will vary depending on the volume of the stock. You can read more about the Force Index is our ChartSchool.


