MailBag September 30, 2011 at 09:31 AM
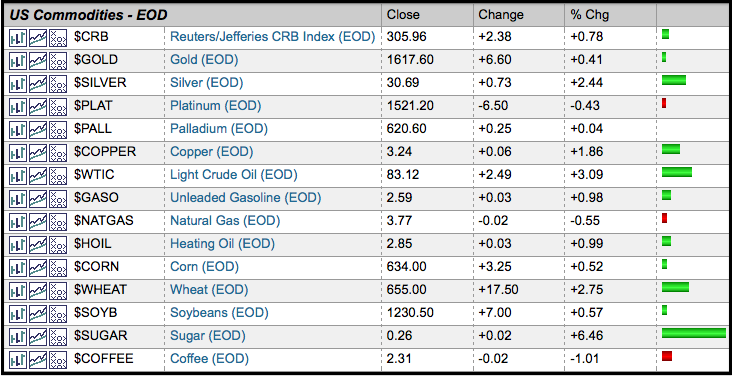
Stockcharts.com provides spot prices for several commodities. These are EOD charts, which means the data is updated at the end of the day (after the close). Chartists can track precious metals, copper, energy related commodities and agricultural commodities. This list can be found on the Market Summary page by choosing “End-of-Day” in the drop down box. The commodity prices can be found by scrolling just below the mid point of the EOD Market Summary page. Click this image to see the EOD Market Summary page. Chartists can also track commodities by using ETFs. These are shown by choosing Read More
MailBag September 23, 2011 at 11:00 AM

The AD Line starts with Net Advances, which is advancing issues less declining issues. Stockcharts.com provides Net Advances data for the AMEX, CDNX, Nasdaq, NYSE and TSE. The symbols are shown at the end of this commentary. First, enter the symbol for Net Advances. In this example, we are using the NYSE Advance-Decline Issues ($NYAD). A line chart, bar chart or candlestick chart will show one big choppy data series that fluctuates between positive and negative territory. To give this data some direction, chartists edit the settings by going to “Chart Attributes” and then “Type”. Click Read More
MailBag September 16, 2011 at 10:48 AM
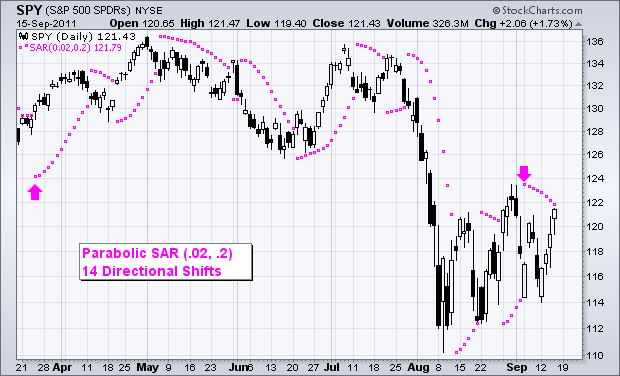
Developed by Wells Wilder, Parabolic SAR stands for Parabolic Stop and Reverse (SAR). It is a popular indicator for setting stops and identifying directional shifts in price. The default setting (.02, .2), however, can produce quite a few directional changes and trigger lots of stops. Chartists can reduce these directional shifts by decreasing the parameters. The first parameter (.02) is called the step. The second parameter (.2) is the maximum step. Reducing the step to .01 and the maximum step to .05 reduces the number of directional changes to four. This allows for bigger moves before Read More
MailBag September 09, 2011 at 08:25 AM
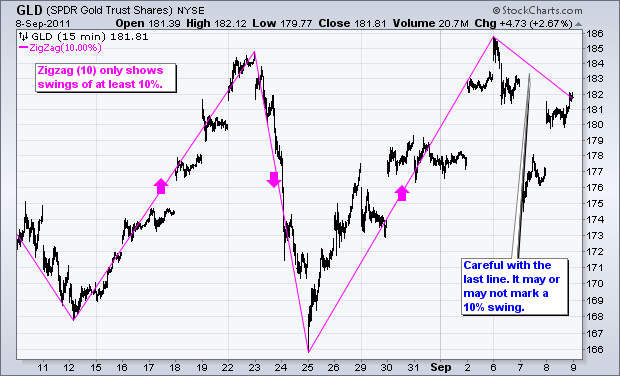
The Zigzag indicator is not really an indicator per se. Instead, it defines price swings that meet a minimum percentage change. Chartists can use this indicator to identify significant price swings and filter out insignificant price swings. The definition of significant is, of course, subjective. A Zigzag set at 10% would only shows swings that were at least 10%. Price swings less than 10% would be ignored. The example below shows a 15-minute chart for the Gold SPDR (GLD) with the 10% Zigzag overlaid. There have been three 10% swings in the last two months. Chartists should ignore that Read More
MailBag September 02, 2011 at 09:51 AM
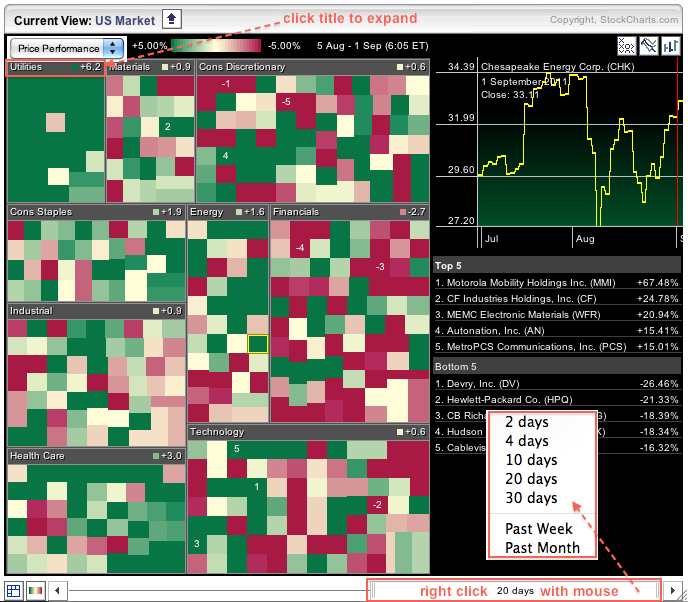
The Sector Market Carpet provides a wealth of information in color-coded format. Moreover, users can tweak this carpet with just a few mouse clicks to dive into the details. The first image shows a classic Sector Market Carpet with Price Performance. The first thing I did was to hover over the slider and right click on the mouse to show time period options. 20 days represents four weeks. Chartists can instantly see that the utilities sector is the strongest because it has the most green and the average change is +6.2%. The finance sector is the weakest because it has the most red and the Read More