MailBag July 26, 2013 at 08:19 AM
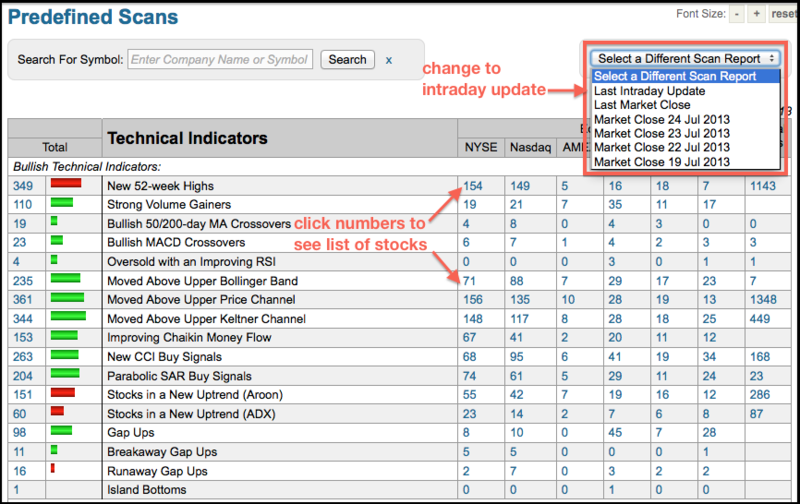
StockCharts updates its predefined scans page throughout the trading day. Chartists can use the dropdown menu in the upper right to change the setting to “last intraday update”. The pre-defined scans page contains dozens of scans organized in bullish and bearish groups. Chartists can find bullish indicator signals, bearish indicator signals, bullish candlestick formations, bearish candlestick formations, bullish P&F signals and bearish P&F signals. Notice how the left column shows the total number of signals. The change is reflected in the horizontal red and green bars. Chartists Read More
MailBag July 19, 2013 at 08:38 AM
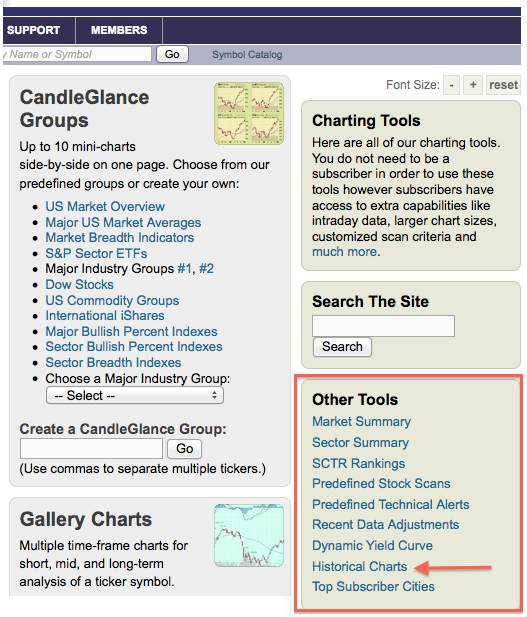
StockCharts provides long-term historical charts for the Dow Industrials, S&P 500, Nasdaq, 30-year Treasury Bond and Gold. These charts can be found by clicking the “historical charts” link on the right navigation of the HOME page of FREE CHARTS page. This link is in the “other tools” section. Once on the page, chartists can click the thumbnails to see these long-term charts. StockCharts has the Dow Industrials going back to 1900, the S&P 500 back to 1960 and gold back to 1980. These are monthly charts that provide a truly historical perspective for Read More
MailBag July 12, 2013 at 07:02 AM
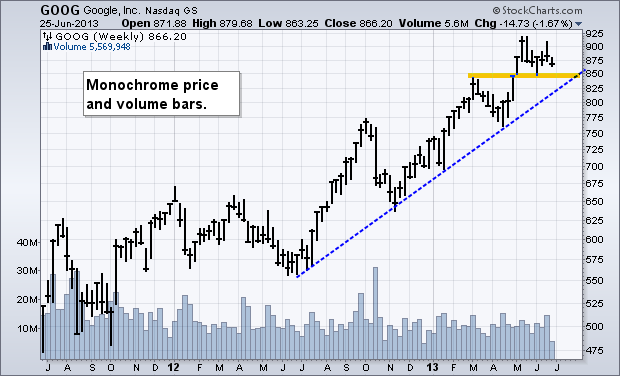
Chartists can add color to any chart by using the check boxes in the “Chart Attributes” section, which is just below the actual SharpChart. A regular SharpChart will show price bars and volume bars as one color. The first example shows Google (GOOG) with black price bars and blue volume bars. Chartists can determine the overall trend and identify patterns, but it can be difficult to differentiate up periods from down periods. Chartists can bring charts to life by checking “Color Prices” and “Color Volume” in the Chart Attributes section. This makes it easy Read More
MailBag July 05, 2013 at 06:58 AM
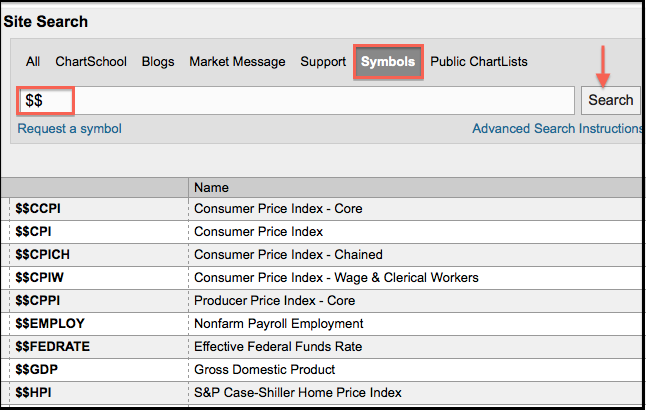
Chartists can plot over 20 different economic indicators at StockCharts. These can be found by searching for “$$” in the symbol catalog (without quotation marks). The image below shows a sample search and results. Click this image for a live search Chartists can plot these economic indicators using our SharpCharts tool. This makes is possible to add indicators for analysis and other symbols for comparative purposes. The example below shows Non-farm Payrolls ($$EMPLOY), its three-month rate of change and the S&P 500 for comparison. Read More