|
|
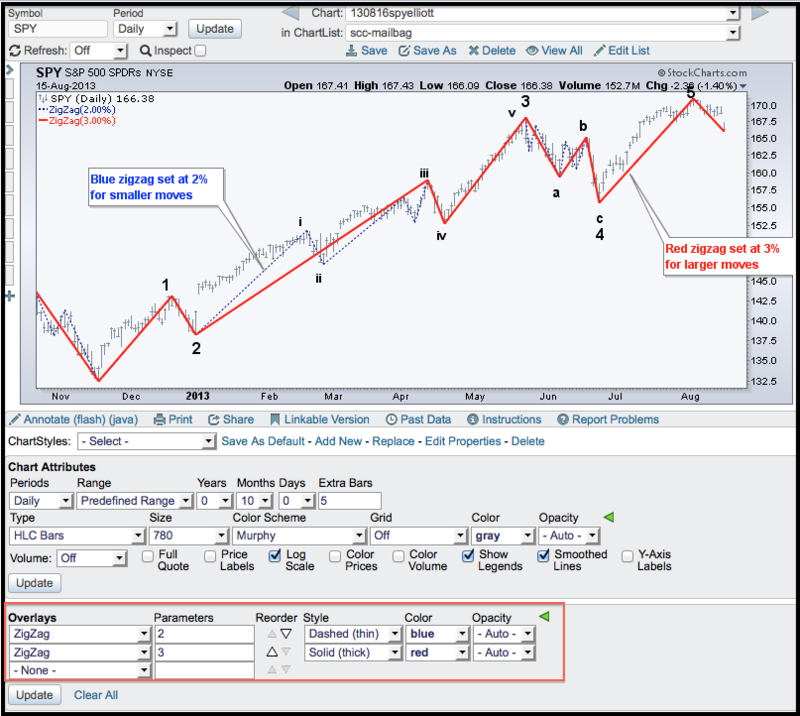
Chartists can use the Zigzag indicator to quantify price movements and identify significant peaks and troughs. The peaks and troughs can then be used to apply an Elliott wave count. The chart below shows the S&P 500 ETF (SPY) with a 3 percent Zigzag (red line) and a 2 percent Zigzag (dotted blue line). The red line shows price moves that are 3% or more, while the dotted blued line shows price moves that are 2% or more. Chartists can use the red line for a larger degree wave count and the blue dotted line for a smaller degree wave count. Based on this count, it looks like SPY just completed a five wave advance, which means we may be embarking on a corrective sequence now. You can read more about the
Zigzag in our ChartSchool.

Click this image for a live chart.

Click this image for a live chart.


Posted by: James Jennings August 17, 2013 at 17:11 PM