|
|
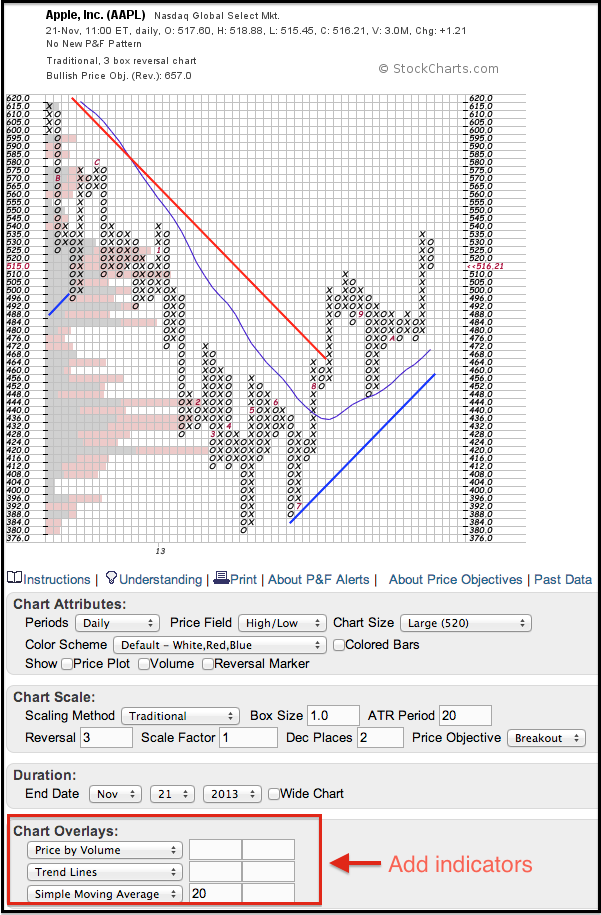
Chartists can add trend lines, moving averages, Bollinger Bands and Price-by-Volume to any Point & Figure chart. First, start by creating a P&F chart using the “create a chart” drop down menu at the top of any StockCharts page. Chartists can then find the indicator options in the “chart overlays” section below the chart. Trend lines are shown by default. The rising blue line is a Bullish Support Line that slopes at a 45 degree angle. The falling red line is a Bearish Resistance Line that slopes at a 135 degree angle (180 less 45). The overall trend is up when above the Bullish Support Line, and down when below the Bearish Resistance Line.
Click this image for a live chart
The example above shows Apple (AAPL) with a 20-period moving average and Volume-by-Price. This moving average, however, is not the same as a 20-period moving average on a bar chart. Instead of closing prices, a Point & Figure moving average is the average price for mid point of the last 20 columns. Chartists can use moving averages to define the overall trend. An uptrend is present when the stock is above the moving average and the moving average is rising. A downtrend is present when the stock is below the moving average and the moving average is falling. You can read more about these P&F indicators in our ChartSchool.


