MailBag December 27, 2013 at 05:58 AM
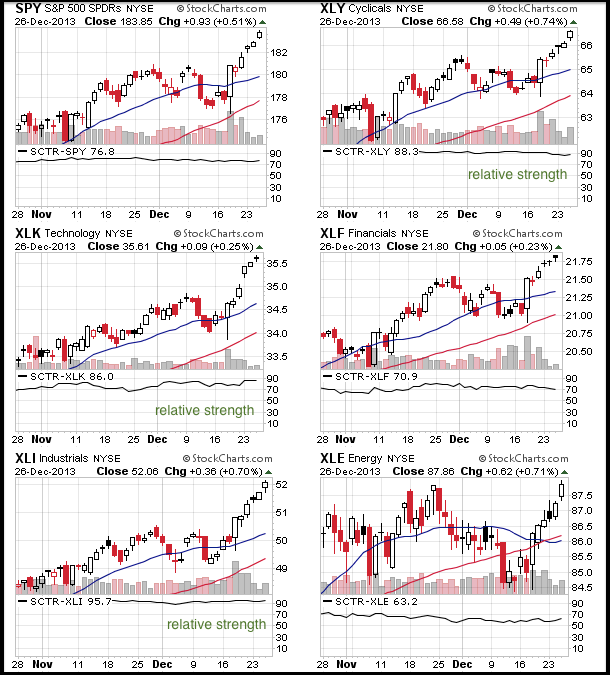
Chartists can compare the StockCharts Technical Rank (SCTR) for the nine sector SPDRs by setting up CandleGlance charts with the SCTR as an indicator. This can be done with three easy steps. First, go to the CandleGlance symbol entry box on the FreeCharts page. This can be found near the top of the third section/column. Second, enter the symbols for the nine sector SPDRs and click go. I threw in the S&P 500 ETF (SPY) for good measure (SPY,XLY,XLK,XLF,XLI,XLE,XLB,XLP,XLV,XLU). Third, scroll down to the bottom of the CandleGlance page and add SCTR as an indicator. Click go and you Read More
MailBag December 20, 2013 at 09:41 AM
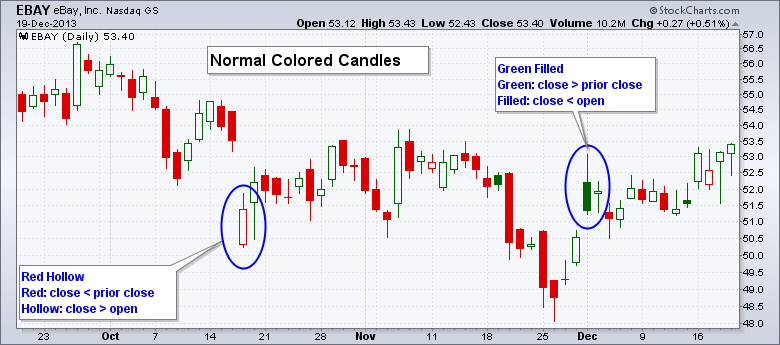
Solid candlesticks are a new feature available on SharpCharts. In short, checking the “solid candles” box will fill and color all candlesticks based on the relationship between the open and the close. First, let’s look at some normal colored candlesticks and review the rules. A candlestick is green when the current close is above the prior close, and red when the close is below the prior close. A candlestick is hollow when the current close is above the current open, and filled (solid) when the close is below the prior open. Read More
MailBag December 13, 2013 at 06:46 AM
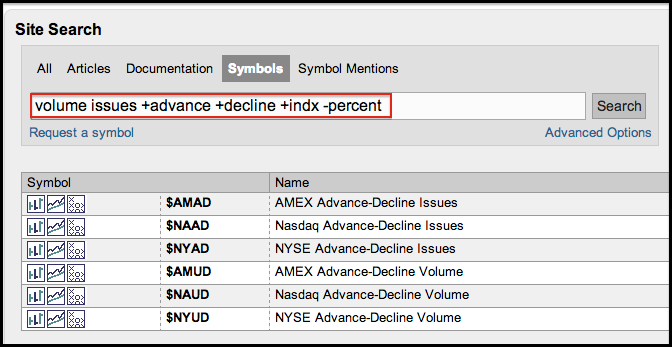
StockCharts subscribers have access to intraday data for the advance-decline indicators covering the AMEX, Nasdaq and NYSE. Note that intraday data is not available for free users. These indicators include advances, declines, net advances, advancing volume, declining volume and net advancing volume. Net advances equals advances less declines, while net advancing volume equals advancing volume less declining volume. Click this image for a live table. Chartists will most likely focus on net advances and net advancing volume because these can be used to create intraday AD Lines and AD Volume Read More
MailBag December 06, 2013 at 09:09 AM
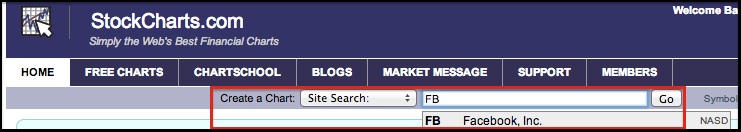
Doing due diligence is integral to trading and StockCharts makes it easy for users to research any symbol in our database. StockCharts users can use the “symbol mention” function in our search boxes to find all references for a symbol. This includes pre-defined scan results, public ChartLists, blog postings and the Market Message. This is a great way to find research on a particular stock, ETF or index. Chartists can find the “site mention” option by using the drop down menu at the top of any web page. Simply enter the symbol, select “site search” and click go. The example below shows a Read More