MailBag April 25, 2014 at 08:40 AM
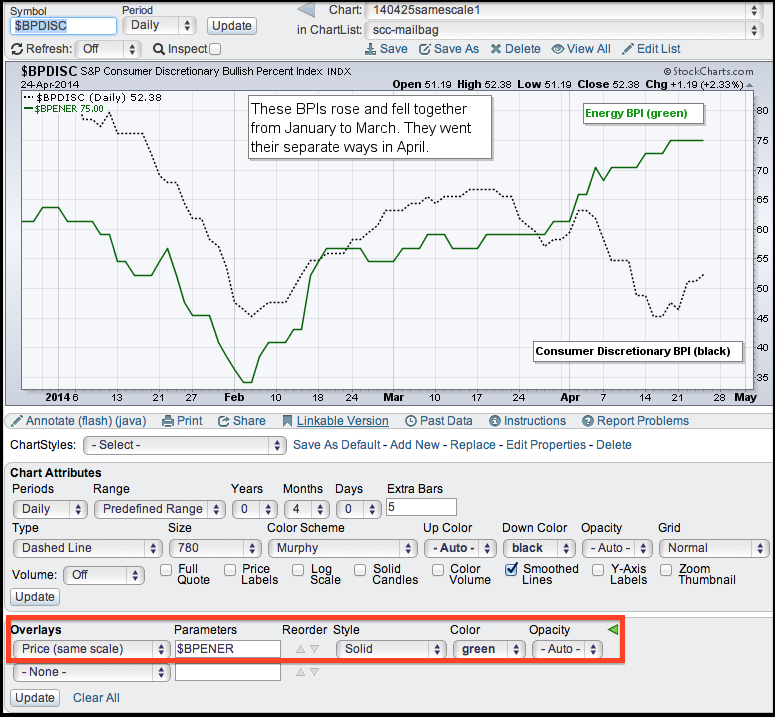
It is sometimes necessary to plot two symbols on the same scale to get a proper comparison. For example, chartists may want to plot interest rates on one scale to see the spreads. The Bullish Percent Indices range from zero to one hundred, which makes them natural candidates for same-scale charting. Plotting these on one scale makes it easier to identify differences and compare absolute levels. Chartists can plot two symbols on one-scale by using the "Price (same scale)" overlay in the Chart Attributes section. Simply choose this option from the drop down menu and then enter the symbol in Read More
MailBag April 04, 2014 at 06:03 PM
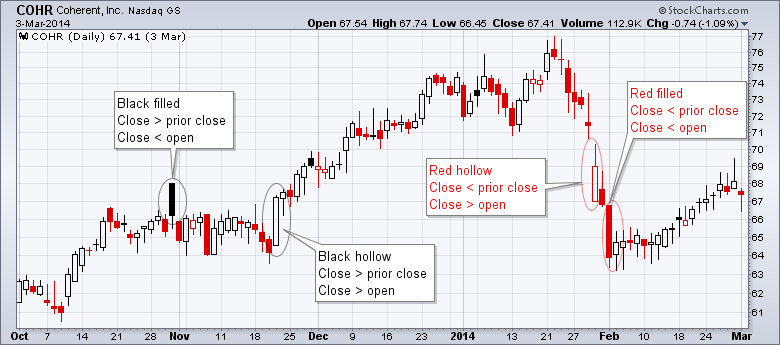
Using the default color settings for a candlestick chart, there are four possible combinations: a red filled candlestick, a red hollow candlestick, a black filled candlestick and a black hollow candlestick. SharpCharts users can also choose different colors for up and down candlesticks. Let's first look at the colors. A candlestick is black when the last price is above the prior close. A candlestick is red when the last price is below the prior close. Using this color-coding, chartists can immediately see if prices closed up or down.The hollow or filled aspect is determined by the Read More