
|
Chartists can change the overall color scheme on a chart as well as price and indicator colors. The first step is to select a "color scheme" from the drop down menu just below the SharpChart. There are over two dozen schemes available. The chart below shows "night", which is a black background.
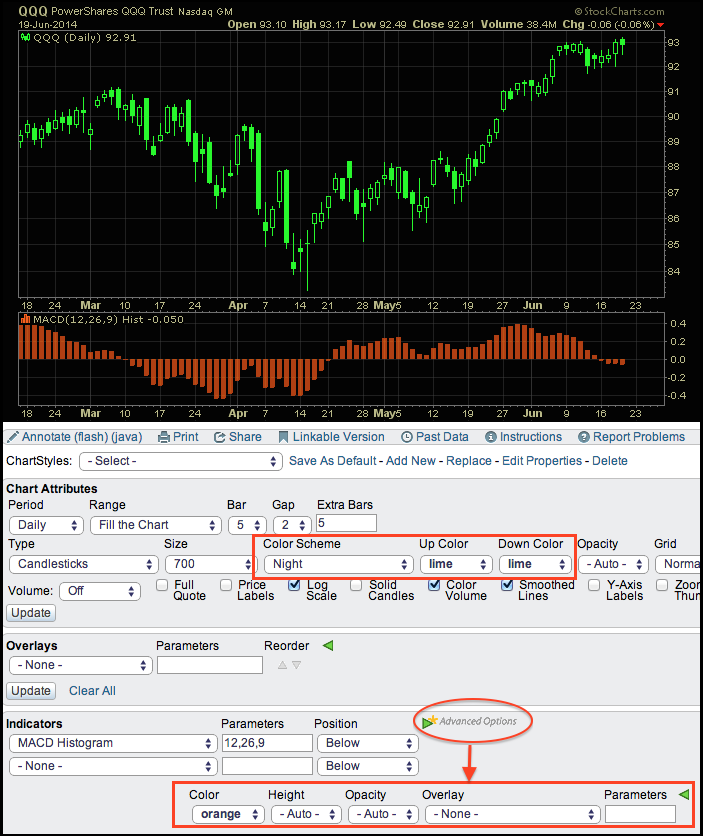
The second step is to change the price colors, which can be done with the drop down menus just to the right of the color scheme. Of the twelve color choices, I chose lime for both up and down candlesticks. This creates a florescent look and makes the prices really stand out. Note that you can choose two different colors: one for up periods and one for down periods.
Chartists can also choose colors for their favorite indicators. The indicator window shows the MACD Histogram in orange. Simply click the green triangle to open "advanced options" and see the color options.
Confused on candlesticks colors and fillings? Click here for a video explaining the different options for candlestick colors.
