
|
Q: It is Saturday afternoon. How do I see the Pivot Point levels for next week? Do I really have to wait until the market opens on Monday to see something that you could show me right now?
A: Good question! You are correct in that as soon as the market closes on Friday, we are able to calculate the Pivot Point levels for next week. The only issue is where can we display them? There's no room on a regular "Fill the Chart" type chart. Here's an example of what I mean:
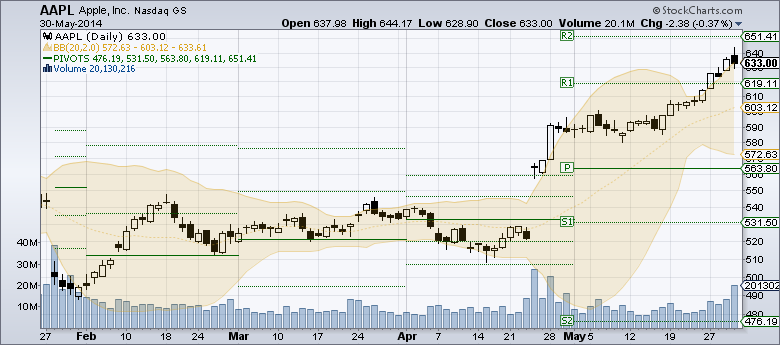
As you can see, the only Pivot Point values are for last week. The values for the upcoming week are not displayed.
In order to see those new levels, you need to give us some room to display them. You do that by adding a number to the "Extra Bars" field located in the "Range" area of the "Chart Attributes" section of the workbench. We recommend using "3" or more in the "Extra Bars" field when working with Pivot Points. Here's what happens when you use "3" Extra bars with the chart from above:
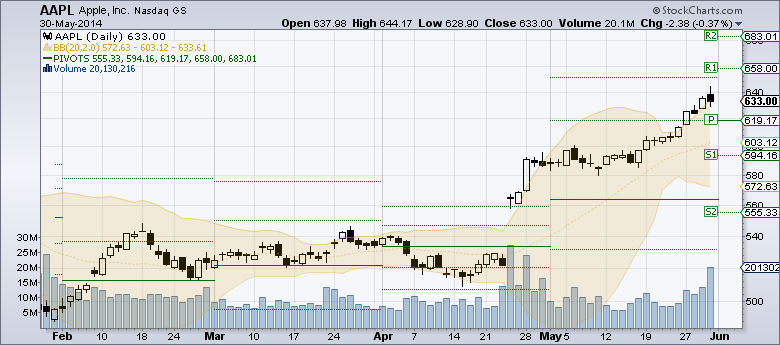
Click here to see a live version of this chart
(Note that this is only an issue when looking at Pivot Points on Daily charts during a weekend.)
- Chip
